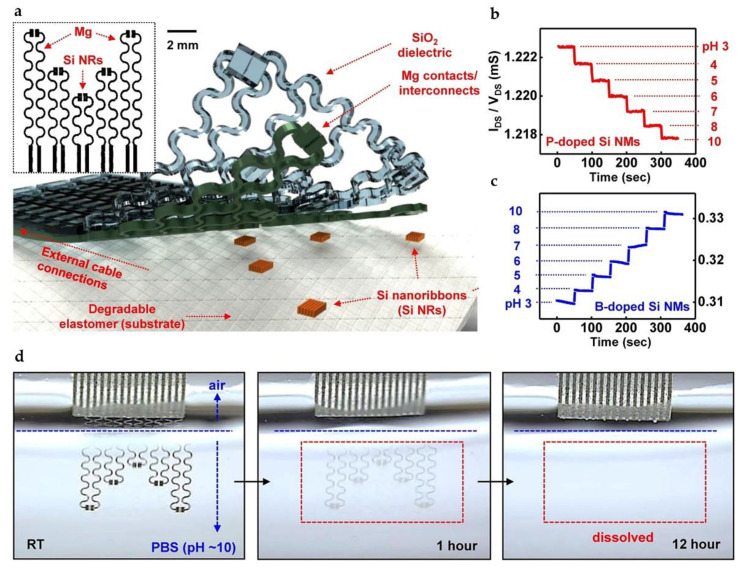
Figure 3.
(a) Schematic illustration of the biodegradable pH sensor; (b) illustration of changes in conductance of phosphorus doped Si NRs in different pH solutions (from 3 to 10); (c) illustration of changes in conductance of boron doped Si NRs in different pH solutions (from 3 to 10); (d) images of the dissolution process with the device immersing in PBS (pH = 10) at room temperature. Reproduced with permission from [24].

