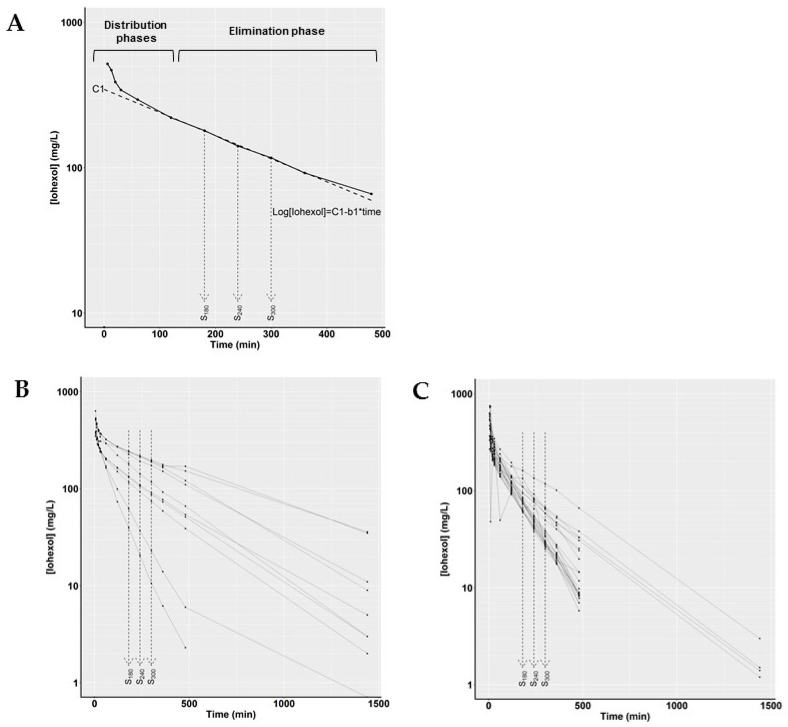
Figure 1.
(A) Example of a typical plasma concentration–time profile after bolus administration of iohexol in a uremic goat (n = 1). Solid circles represent the iohexol plasma concentrations, the dotted line represents the linear regression (intercept; C1, slope; b1) over the log-transformed iohexol plasma concentrations taken at sample times 180, 240 and 300 min (S180, S240 and S300, respectively). (B,C) Plasma concentration–time profiles of all iohexol plasma clearance measurements after bolus administration of iohexol in goats (B) and pigs (C). Circles represent the iohexol plasma concentrations, the dotted lines represent the iohexol plasma concentrations taken at S180, S240 and S300, which were used for linear regression analysis according to the simplified method.

