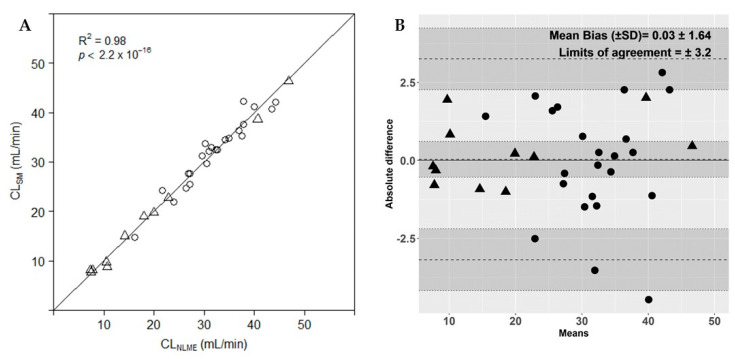
Figure 4.
(A) Comparison of the measured iohexol plasma clearance based on a nonlinear mixed effects model (CLNLME) and calculated iohexol plasma clearance based on the simplified method (CLSM) in goats (triangles) and pigs (circles). Solid line, line of unity. (B) Bland–Altman plot of agreement between iohexol plasma clearance determined by a nonlinear mixed effects model and by the simplified method for goats (triangles) and pigs (circles). Dotted lines represent bias, upper and lower limits of agreement. Grey shaded areas represent the 95% confidence intervals of the bias, upper and lower limits of agreement.

