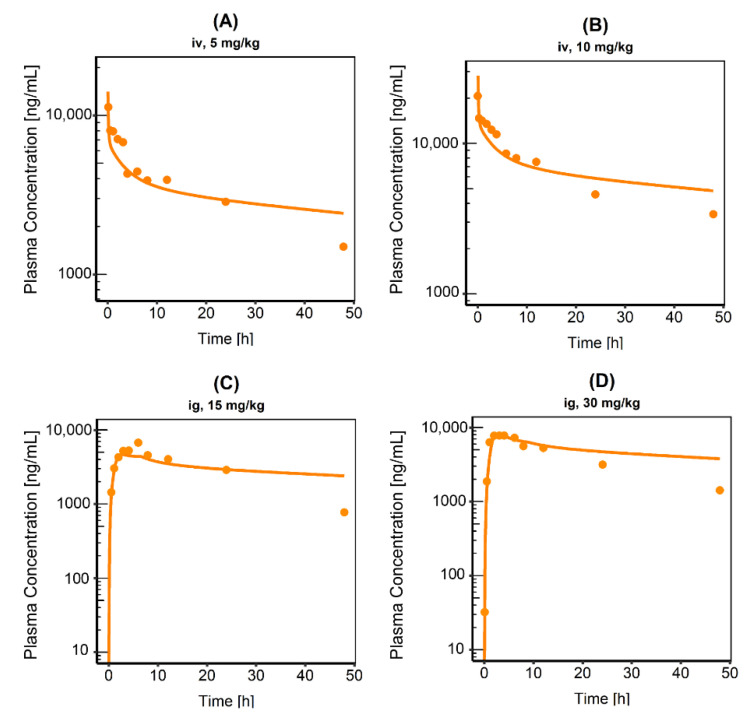
Figure 1.
Semi-logarithmic plots of plasma concentration time profiles following (A) 5 mg/kg intravenous (iv), (B) 10 mg/kg iv, (C) 15 mg/kg intragastric (ig) or (D) 30 mg/kg ig administration of CAB. Observed data are shown as dots, simulations are shown as lines. All data extracted from Wang et al., n = 8 in every case.

