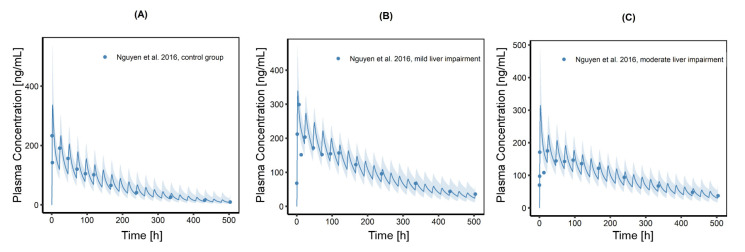
Figure 8.
Population simulations (n = 100) of CAB plasma concentration time profiles after a single dose of 60 mg CAB capsule to (A) the healthy control group, (B) patients with mild liver impairment and (C) patients with moderate liver impairment. Blue dots indicate mean observed plasma concentrations, the blue line represents the population simulations geometric mean of the predicted plasma concentrations; the shaded areas represent the predicted population geometric SD.

