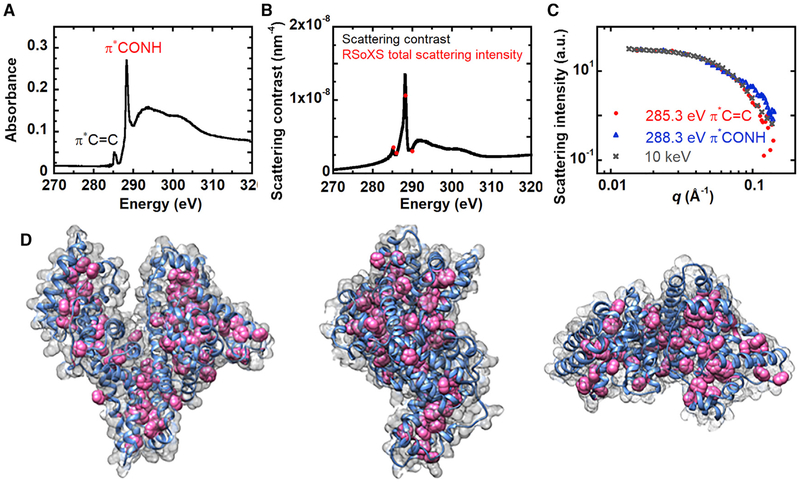
Figure 2. Scattering Contrast between BSA and PBS Solutions Near the Carbon K Edge.
(A) BSA NEXAFS spectra.
(B) Total scattering intensity at different energies calculated from RSoXS (red dots) near the carbon edge for 10 mg/mL BSA in 1× PBS. Black curve is the scattering contrast.
(C) RSoXS scattering intensity profiles of 10 mg/mL BSA in 1× PBS at 285.3 eV and 288.3 eV (at resonance of the carbon K edge) and SAXS scattering intensity profile at 10 keV.
(D) Visualization of all carbon atoms (gray mesh), backbone CONH (blue), and aromatic rings containing C=C double bonds (pink) in the protein molecule (generated from crystallographic data PDB: 3V03).

