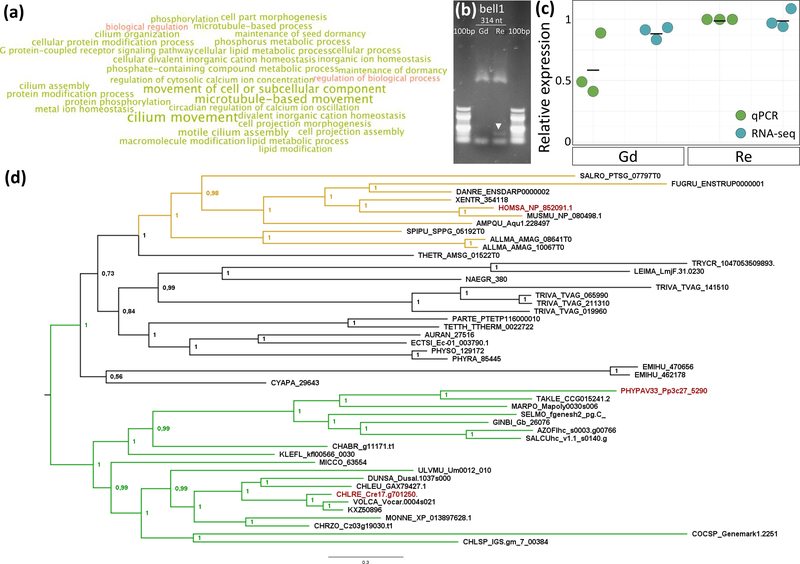
Figure 3: Physcomitrella patens bell1 and ccdc39 expression, GO bias of DMP/SNP overlap and ccdc39 phylogeny.
(a): Gene Ontology bias analysis of genes differentially methylated and SNP- containing in comparison of Gd vs. Re. The intersect of DMP and SNP affected genes shows over-representation of GO terms associated with cilia motility. Over-represented terms are shown in green, whereas under-represented terms are shown in red. Larger font size correlates with a higher significance level.
(b): RT-PCR expression analysis of genes expressed in Gd and Re adult apices shows expression of bell1 (314 nt) in the Re (white arrow) but not in the Gd background.
(c): Relative expression of ccdc39 in qPCR (green, n = 3) and RNA-seq (blue, n = 3) data shows higher expression in Re (mean qPCR: 1, mean RNA-seq: 1) in comparison to Gd (mean qPCR: 0.6, mean RNA-seq: 0.89). Mean marked by black bars.
(d): Phylogenetic analysis of CCDC39 shows clear correlation with the presence of flagella and generally reflects species relationships. Planta are shown in green, opisthokonts in yellow, protozoa, SAR and fungi in black. Homo sapiens, Chlamydomonas reinhardtii and Physcomitrella patens are marked in red.

