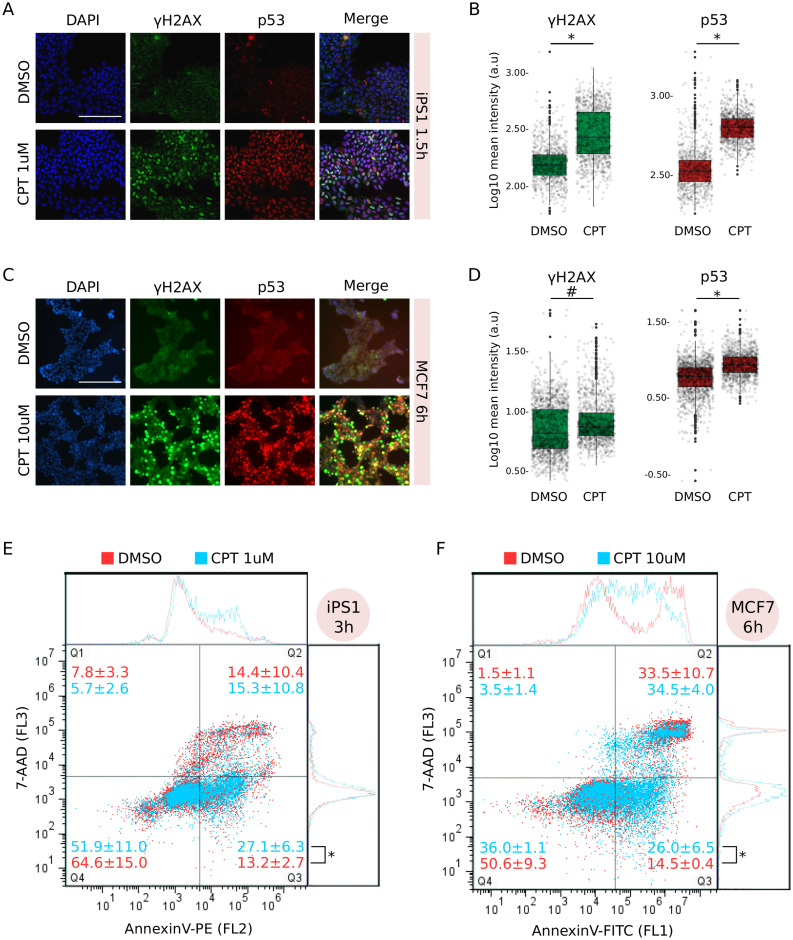
Fig 1. Camptothecin treatment induced apoptosis in both iPS1 pluripotent stem cell and MCF7 cancer cell lines.
A) Immunostaining with anti-γH2AX and anti-p53 of iPS1 pluripotent cell line treated (CPT 1μM) or not (DMSO: vehicle) with CPT for 1.5h. Both marks were merged with DAPI to reveal cell nuclei and scale was set to 200μm (white bar). Images are representative of four different microscopic fields. B) Distribution of mean signal intensity per nucleus in all fields from A, measured in arbitrary units (log10 a.u.) for γH2AX (left) and p53 (right) marks. Statistical significance between CPT and DMSO was evaluated by Welch Two-Sample t-test (*p-value = 2.2e−16). C) Immunostaining as in A for MCF7 cancer cell line treated (CPT 10μM) or not with CPT for 6h. D) Mean signal intensity quantification and statistical significance were determined as in B (#p-value = 4.89e−7; *p-value = 2.22e−16). E) Flow cytometry analysis with AnnexinV-PE of iPS1 cells treated with CPT 1μM (light blue) for 3h compared to DMSO (red). Incubation with 7-AAD was performed to discriminate dead cells (Q2) from early apoptotic (Q3). Number of events (cells) in each quadrant is presented as mean percentage of total population ± SEM of three independent replicates. Statistical significance between conditions in Q3 was evaluated with Welch Two-Sample t-test (*p-value = 2.5e−2). F) MCF7 cancer cells treated with CPT 10μM (light blue) for 6h were analysed as in E, though using AnnexinV-FITC instead of PE.

