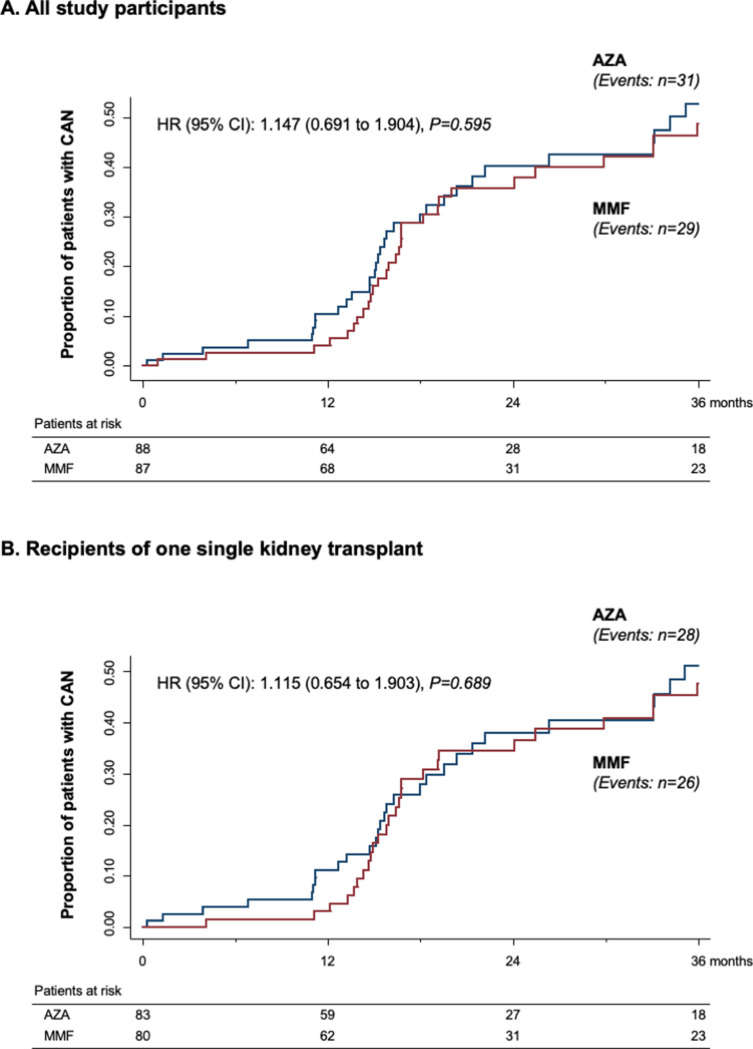
Fig 2. Kaplan–Meier curves of the percentages of patients with CAN in the 2 randomization arms.
Kaplan–Meier curves of the percentages of patients with CAN during the 3 years of follow-up in the MMF (red line) and in the AZA (blue line) groups in the overall patient population (A) and in patients who received a single kidney transplant (B) considered separately. AZA, azathioprine; CAN, chronic allograft nephropathy; CI, confidence interval; HR, hazard ratio; MMF, mycophenolate mofetil.

