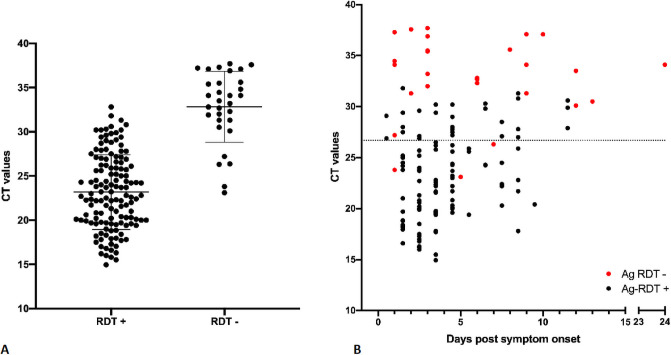
Fig 1. SARS-CoV-2 detection by Panbio™ antigen rapid test using OPS compared to the reference RT-qPCR detection method using NPS.
A. Ct values, viral load and Ag-RDT results for 166 RT-PCR-positive individuals. Horizontal bars represent median and standard deviation. Dotted line: Ct value of 26.7 or 1E6 SARS-CoV-2 RNA copy numbers/mL. Note: Two samples were excluded because of low viral load (positive signal in ORF1 assay but negative signal in E-gene target, thus excluded from the graph. Both samples gave a negative RDT result). B. Ct values, viral load, days post symptom onset and Ag-RDT results for 139 patients for which information on day of symptom onset was available. Dotted line: Ct value of 26.7 or 1E6 SARS-CoV-2 RNA copy numbers/mL.

