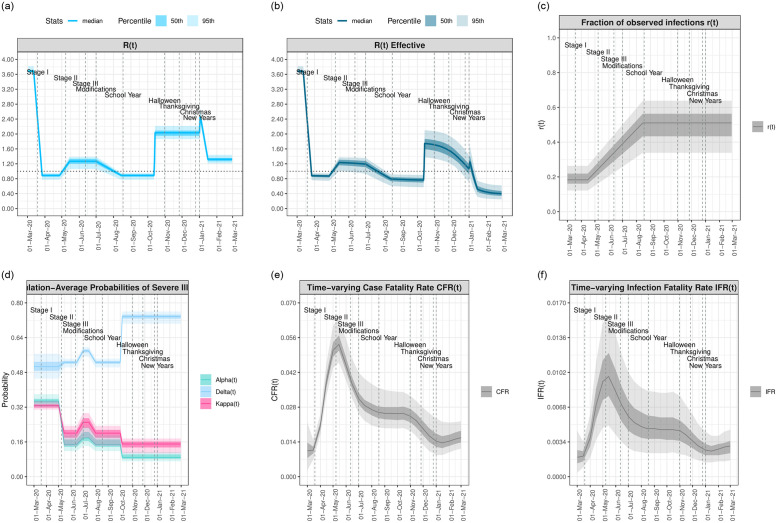
Fig 4. Timeseries of model-estimated parameters relative to key dates and COVID-19 policy decisions in LAC.
Model-estimated median curves are plotted along with the 50th% (dark shading) and 95% CI (light shading). (a) Rt, the time varying reproduction number. (b) Reff,t, the effective reproduction number. (c) rt, proportion observed infections. (d) αt, the probability of hospitalization given infection; κt, probability of ICU admission given hospitalization; and δt, probability of death given admission to the ICU. (e) Population-average case fatality rate, CFRt. (f) Population-average infection fatality rate, IFRt.

