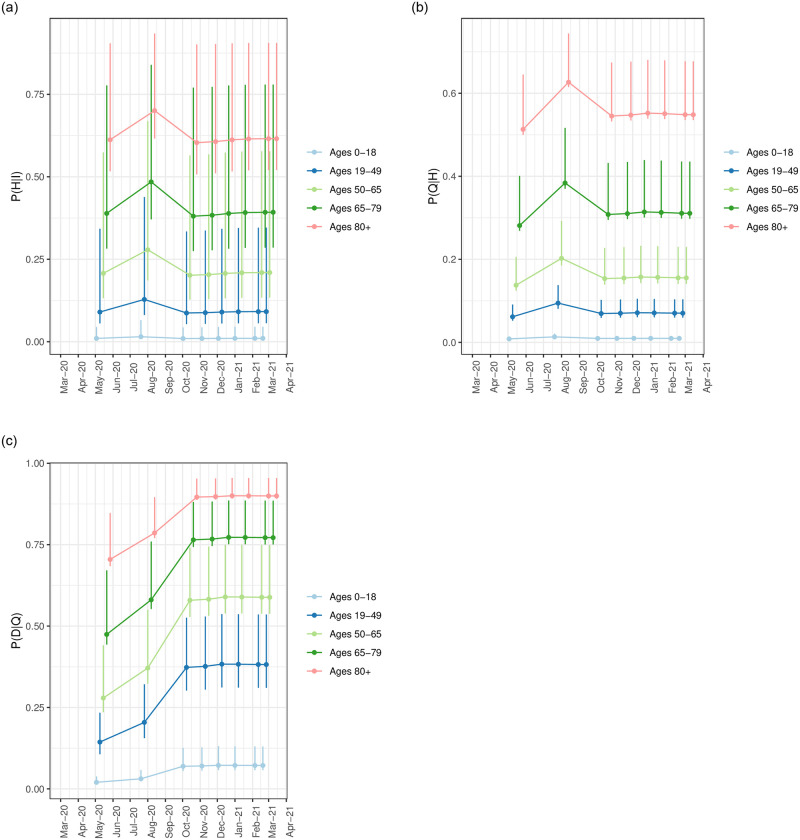
Fig 5. Range of the probabilities of hospitalization given infection across each risk profile, , summarized for each age group.
Each figure shows the mean (as a point), and minimum and maximum (error bar) probability for each age group 0 − 18, 19 − 49, 50 − 64, 65 − 79, 80+, under each risk model. (a) Range of the probabilities of ICU admission given hospitalization across each risk profile, , summarized for each age group. (b) Range of the probabilities of death given ICU admission across each risk profile, , summarized for each age group. (c) Range of probabilities of disease stage progression for the three models , , and across all risk profiles within each age group.

