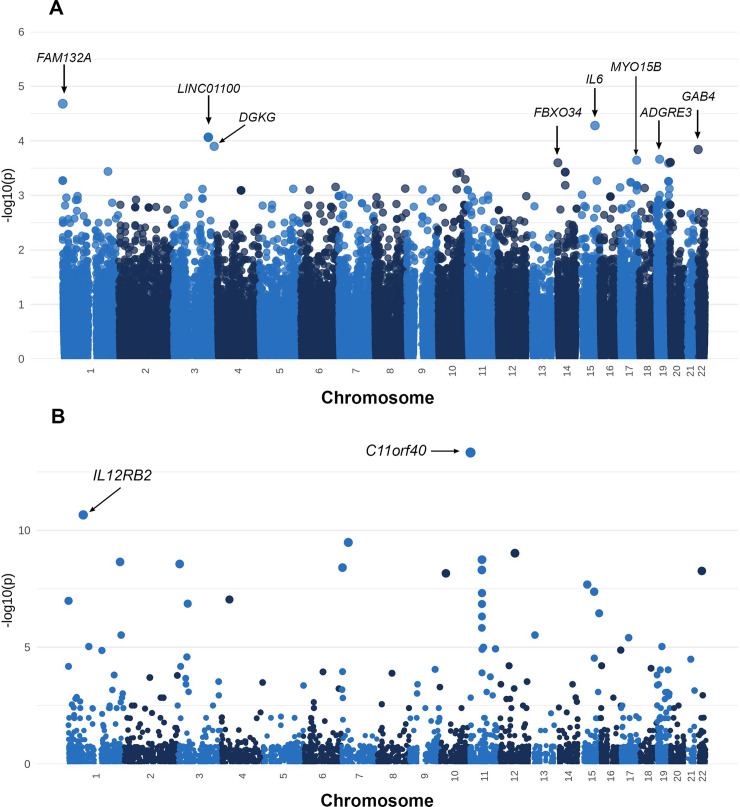
Fig 3. Association analyses of common and rare variants.
(A) Manhattan plot of the Firth’s logistic modelling for common variants of the CZS dataset (n = 35). We modeled the parameters considering the binary response (CZS / Control) and the genetic variants while adjusting for the gestational exposure to ZIKV in the mother. Each point corresponds to a genetic variant. (B) Manhattan plot of the results of the C-alpha test of the CZS dataset (n = 35), we determine the differential distribution and accumulation of rare variants grouped in genes between cases and controls. Each point represents a gene.

