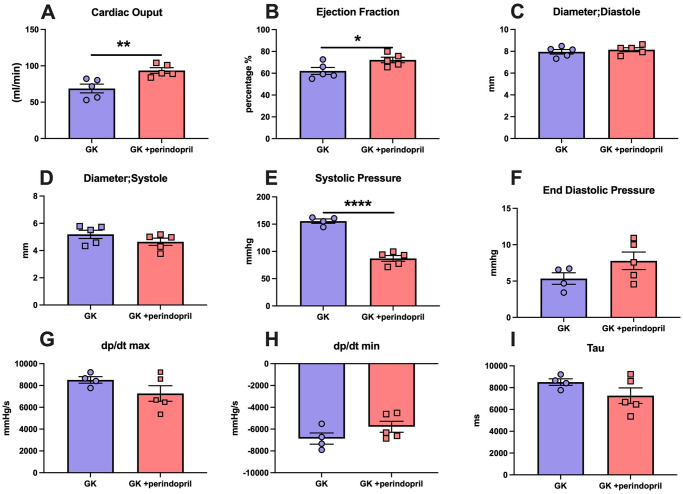
Fig 5. Echocardiographic and cardiac catheterization parameters of GK rats and GK rat treated with Angiotensin Converting enzyme inhibitor perindopril.
A-D represents echocardiographic analysis taken from short axis M-mode view demonstrating (A) cardiac output, (B) ejection fraction, (C) diameter in systole and (D) diameter in diastole. E-I represent analysis of cardiac catherization (E) systolic pressure, (F) end diastolic pressure (G) Dp/dt max, (H) Dp/dt min and (I) Tau. All parameters were measured in Goto Kakizaki rats either treated with saline (GK) or ACE inhibitor perindopril (GK + perindopril). Where * = p<0.05, ** = p<0.01, *** = p<0.001 and **** = p<0.0001 when compared to GK rats; (student’s t-test was used to compare groups). Data is expressed as mean±SEM N = 4–5 per group.

