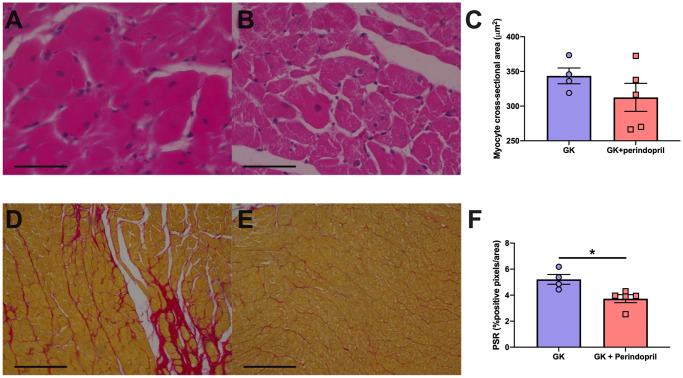
Fig 6. Cardiac structure in control GK rats and GK rats treated perindopril.
Representative hematoxylin and eosin-stained sections and PicroSirius red stained sections. Hearts of Goto Kakizaki (A,D) rats and Goto Kakizaki rats treated with Angiotensin Converting enzyme inhibitor perindopril (B,E) had myocyte hypertrophy (C) and fibrosis (F, positive PSR stained pixels) measured. Parameters were measured in Goto Kakizaki rats either treated with saline (GK) or ACE inhibitor perindopril (GK + perindopril). * = p<0.05, when compared to GK rats (student’s t-test was used to compare groups). Data is expressed as mean±SEM N = 4–5 per group. Scale bars (A-B) 50μm and (C-D) 300 μm.

