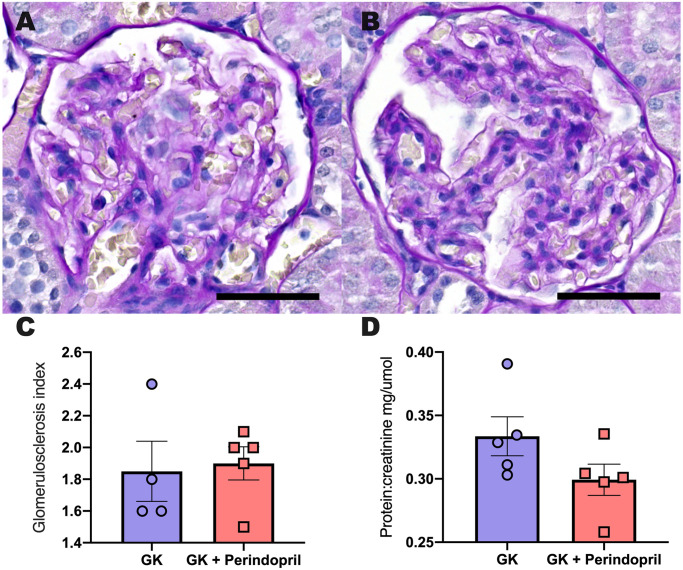
Fig 8. Kidney Structure and function in control GK rats and GK rats treated with perindopril.
Representative PAS images of and Goto Kakizaki rats (A) and Goto Kakizaki rats treated with Angiotensin Converting enzyme inhibitor perindopril (B), respectively. Glomerulus score index (C) and analysis of protein; creatine (D) following treatment. Parameters were measured in Goto Kakizaki rats either treated with saline (GK) or ACE inhibitor perindopril (GK + perindopril). a student’s t-test was used to compare groups and no significant difference was identified. Data is expressed as mean ± SEM N = 4–5 per group. Scale bars 50 μm.

