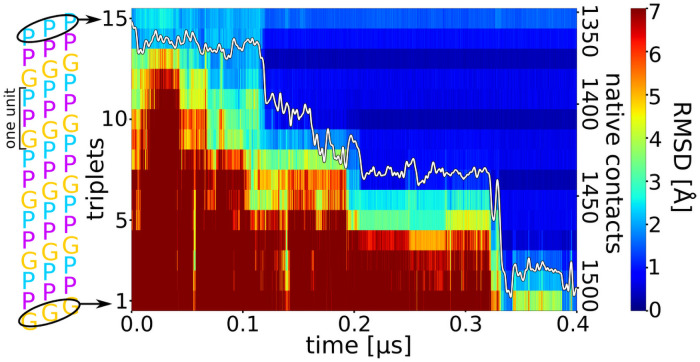
Fig 2. Time course of triple helix formation during an MD simulation.
The simulation starts from an unfolded collagen peptide with an already formed nucleus at the C-terminus (see Fig 1A). Each labelled stripe (1–15) represents a residue triplet (residues with same number in each chain, indicated as black ellipse in the left panel) along the three strands. The root-mean-square deviation (RMSD) of each residue triplet relative to the native folded structure is indicated by a color-code (color bar on the right side). A blue color represents sampled states close to native, whereas red color corresponds to an unfolded triplet structure. The y-axis on the right side of the plot gives the number of formed native contacts (white line in the plot).

