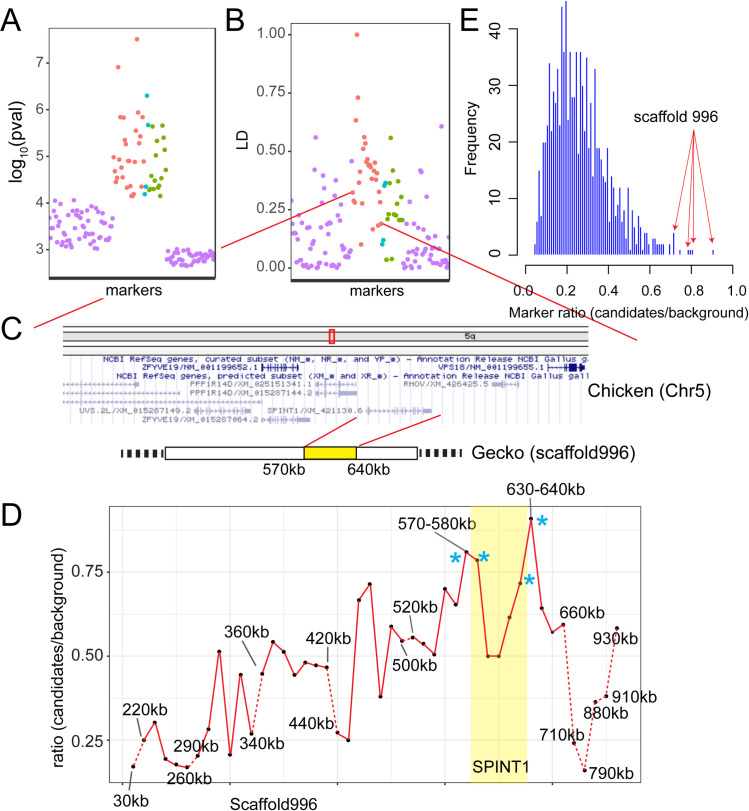
Fig 3. Localization of the Lemon Frost mutation.
(A) p-value for association with white color and (B) linkage disequilibrium for 28 markers syntenic to chicken chromosome 5 (red, ordered by synteny), 4 markers syntenic to chromosome 7 (cyan), and 16 markers without synteny information (green). Randomly selected markers that are not associated with white color (purple). (C) A schematic of the region showing synteny and gene annotation. (D) Fraction of markers showing expected allele frequency pattern in pools, plotted for 10kb windows along scaffold 996. The four windows with the highest fraction are marked by asterisks and span the location of the gene SPINT1. Windows with fewer than 5 variants were not plotted (dashed red lines). (E) Genome-wide distribution of the fraction of markers showing expected allele frequency pattern in pools for all 10 kb windows. The 4 highest windows on scaffold 996 (red arrows) marked in D are among the 6 highest windows in the entire genome.

