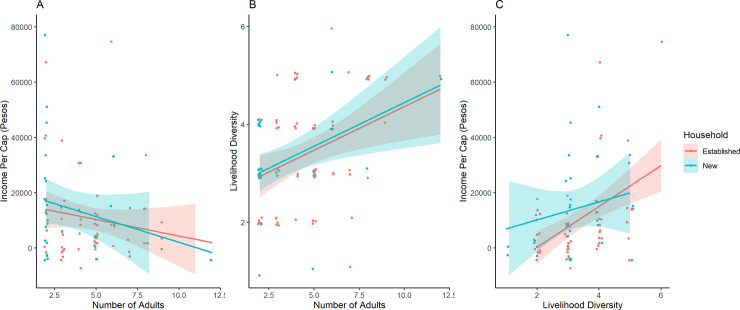
Fig 2. Bivariate associations between income, household size, and livelihood diversity.
Association between (A) household size and income per capita, (B) household size and livelihood diversity, and (C) livelihood diversity and income per capita. Data are stratified by established and new households. Shaded areas represent the 95% CI of the OLS line.

