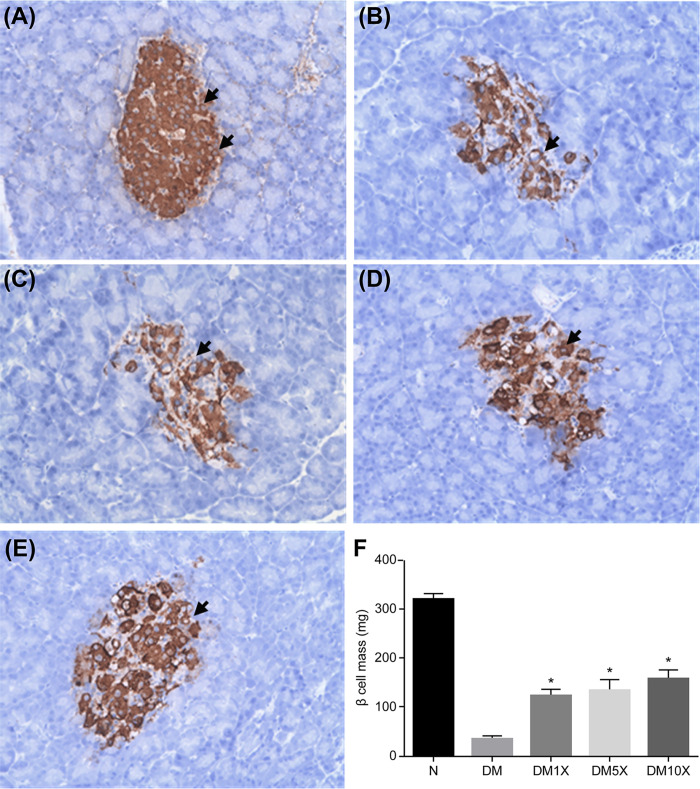
Fig 3.
Microscopic image of the pancreas of (A) untreated rats (N, control group), (B) streptozotocin (STZ)-treated rats (DM, STZ group), and (C–E) STZ + ProbiogluTM-treated rats (DM1X: STZ + 1× ProbiogluTM group, 5.17 × 10⁹ CFU kg-1 d-1; DM5X: STZ + 5× ProbiogluTM group, 2.58 × 10¹⁰ CFU kg-1 d-1; DM10X: STZ + 10× ProbiogluTM group, 5.17 × 10¹⁰ CFU kg-1 d-1) at the end of the experimental period. (F) Mean β-cell mass in each group at the end of the experimental period. Each group consisted of 8 rats in this study. * indicates significant differences compared with the control: p < 0.05.

