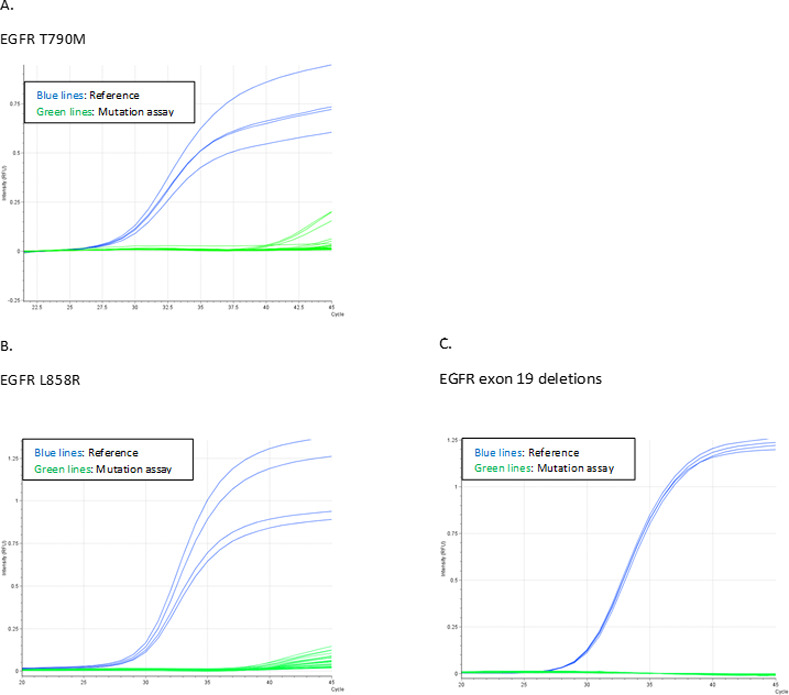
Fig 5. Test of LoB.

Graphs describing the LoB evaluation based on the characterization of repeated testing of cfDNA pooled from 58 healthy donors A. Curves representing the T790M LoB results. B. Curves representing the L858R LoB results. C. Curves representing the EGFR exon 19 deletion LoB results.
