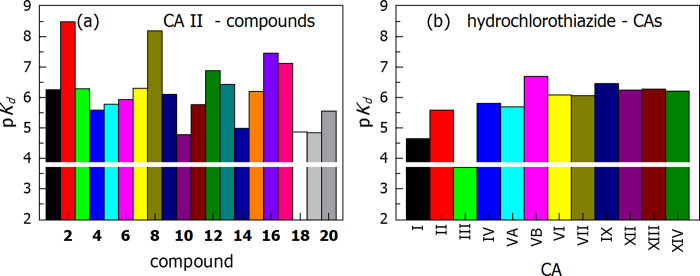
Fig 5. Selectivities of compound binding to CA isoforms are shown as affinity bars expressed in pKd.
Panel (a) shows the binding of compounds to CA II. Affinities differed up to three orders of magnitude for various compounds. Panel (b) shows hydrochlorothiazide 4 binding to the twelve catalytically active human CA isoforms. Affinities varied by up to approximately one order of magnitude among CA isoforms. Most isoforms exhibited affinity of single-digit micromolar order of magnitude. The white horizontal line shows the lower limit of binding detection of 200 μM by FTSA.

