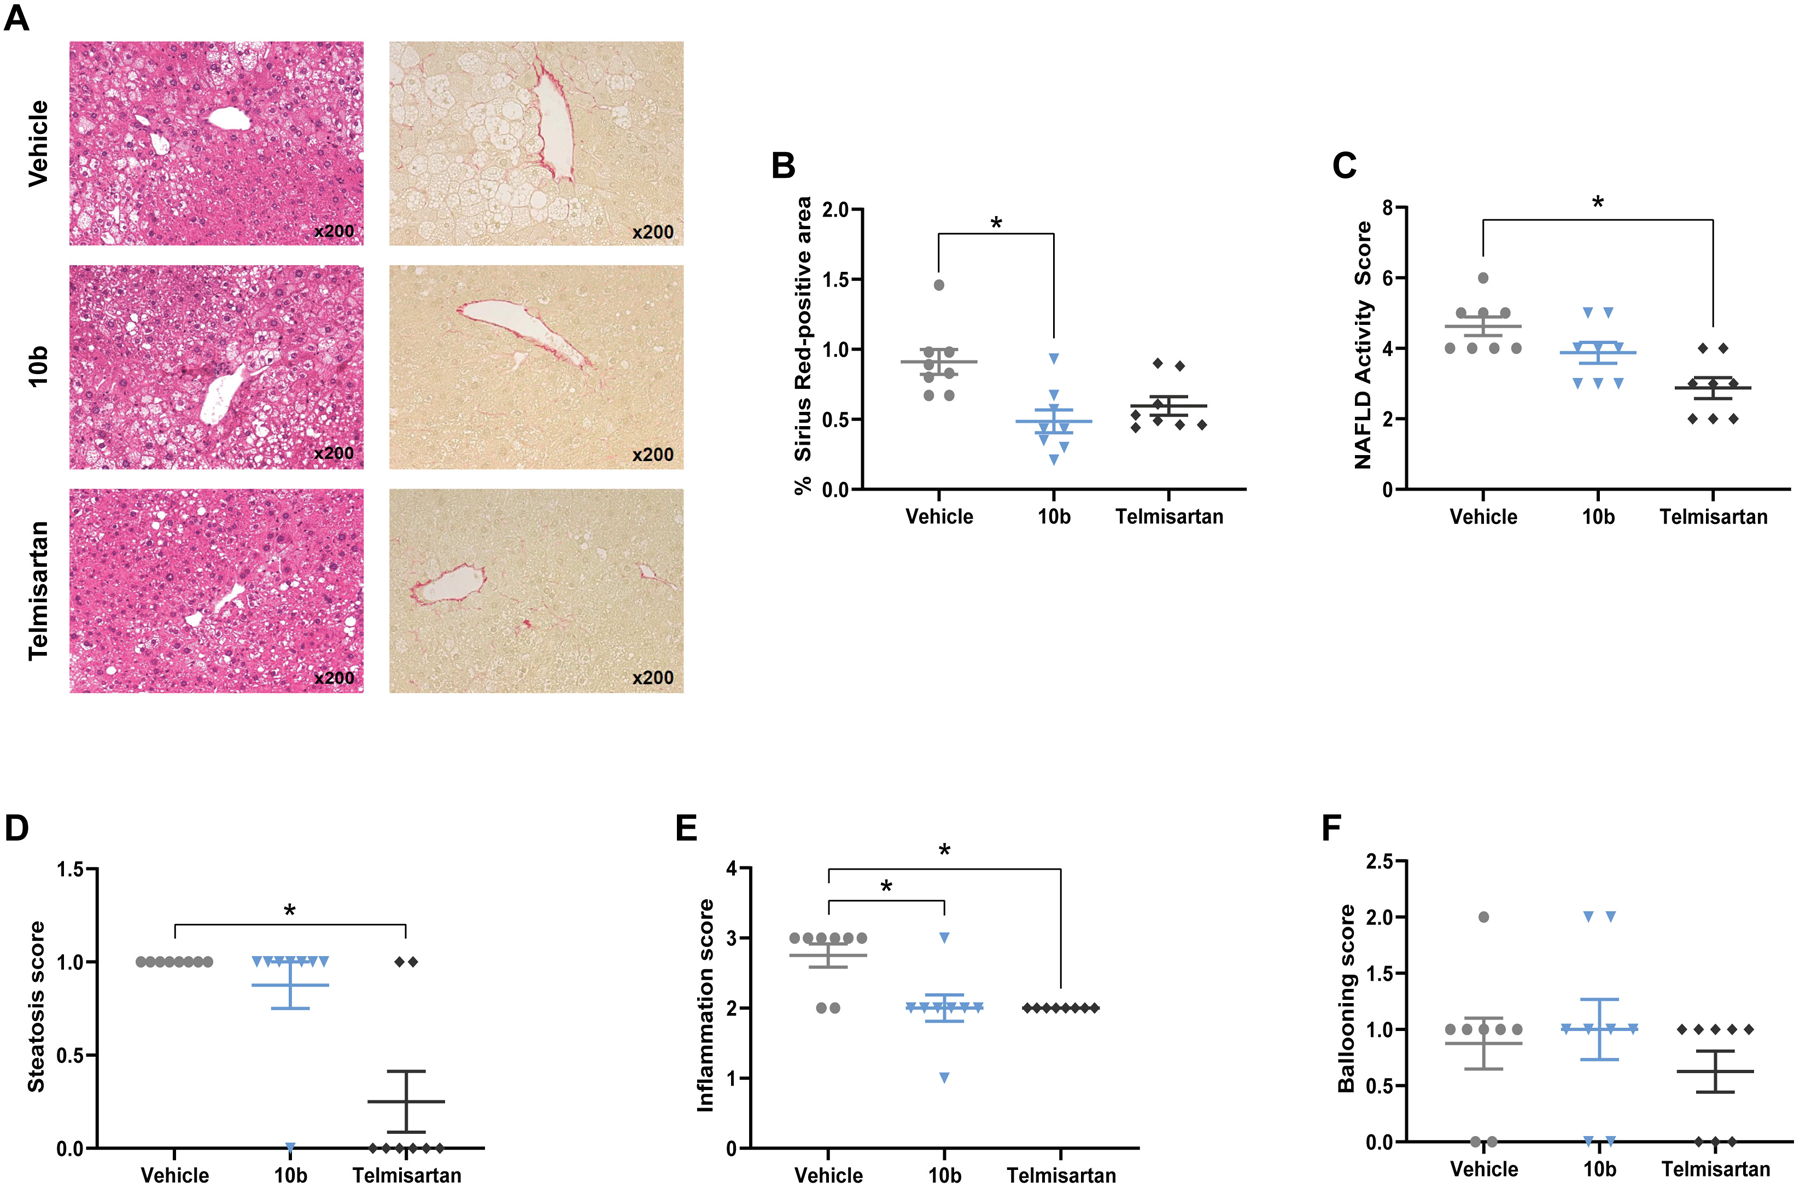
Figure 4.

Effect of compound 10b on liver histopathologic and biochemical phenotypes in the STAM mouse model. Representative images of Hematoxylin and Eosin staining and Sirius Red staining in liver sections (A), Sirius Red staining quantified as a measure of fibrosis (B). NAFLD Activity Score (C) is the sum of individual parameters: steatosis (D), inflammation (E), and ballooning (F). Graphs show mean ± SEM. * indicates p < 0.05, by Kruskal-Wallis test with Dunn’s correction for multiple comparisons for non-parametric data. n=8 male mice per group.
