. Author manuscript; available in PMC: 2021 Jun 24.
Published in final edited form as: J Med Chem. 2020 Feb 17;63(5):2511–2526. doi: 10.1021/acs.jmedchem.9b01440

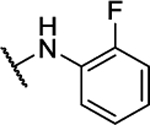
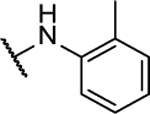
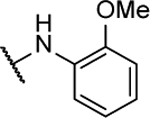
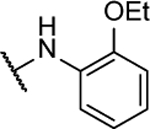
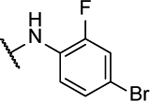
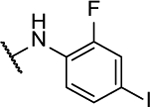
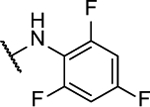
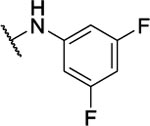
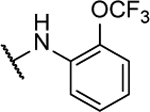
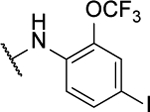
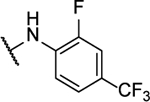
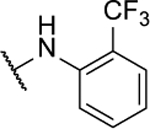
Table 1.

Oxygen consumption rates of symmetrical derivatives in L6 rat myoblast cells.
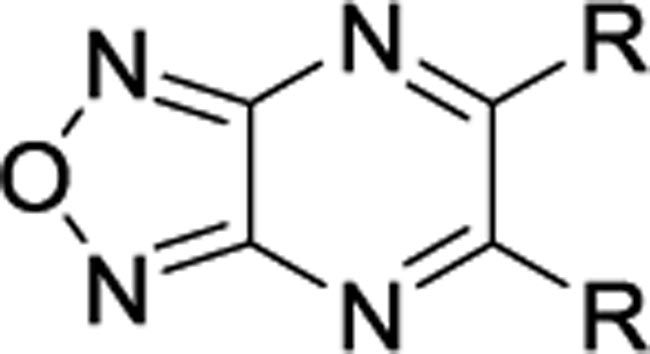
graphic file with name nihms-1710438-t0002.jpg
Entry R % of BAM15 OCRa EC50, μM Entry R % of BAM15 OCRa EC50, μM
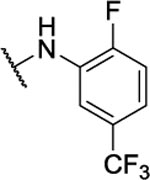
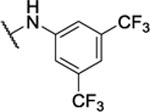
BAM15 graphic file with name nihms-1710438-t0003.jpg 100%b 0.49 ± 0.06 8q graphic file with name nihms-1710438-t0004.jpg NA --
8a graphic file with name nihms-1710438-t0005.jpg 33%b 2.3 ± 0.7 8r graphic file with name nihms-1710438-t0006.jpg NA --
8b graphic file with name nihms-1710438-t0007.jpg 22%c 2.1 ± 1.3 8s graphic file with name nihms-1710438-t0008.jpg NA --
8c graphic file with name nihms-1710438-t0009.jpg 59%c >20 8t graphic file with name nihms-1710438-t0010.jpg 21%b 3.9 ± 1.1
8d graphic file with name nihms-1710438-t0011.jpg NA -- 8u graphic file with name nihms-1710438-t0012.jpg 18%b >100
8e graphic file with name nihms-1710438-t0013.jpg 43%c >100 8v graphic file with name nihms-1710438-t0014.jpg 8%b 2.2 ± 0.4
8f graphic file with name nihms-1710438-t0015.jpg 14%c >100 8w graphic file with name nihms-1710438-t0016.jpg NA --
8g graphic file with name nihms-1710438-t0017.jpg NA -- 8x graphic file with name nihms-1710438-t0018.jpg 5%b <3
8h graphic file with name nihms-1710438-t0019.jpg 45%c 10.1 ± 0.7 8y graphic file with name nihms-1710438-t0020.jpg 27%b 8.8 ± 3.2
8i graphic file with name nihms-1710438-t0021.jpg NA -- 8z graphic file with name nihms-1710438-t0022.jpg NA --
8j graphic file with name nihms-1710438-t0023.jpg NA -- 8aa graphic file with name nihms-1710438-t0024.jpg 17%b 1.1 ± 0.4
8k graphic file with name nihms-1710438-t0025.jpg NA -- 8ab graphic file with name nihms-1710438-t0026.jpg 7%b <1 μM
8l graphic file with name nihms-1710438-t0027.jpg NA -- 8ac graphic file with name nihms-1710438-t0028.jpg NA --
8m graphic file with name nihms-1710438-t0029.jpg 53%c 1.1 ± 0.2 8ad graphic file with name nihms-1710438-t0030.jpg 0.5%b <1 μM
8n graphic file with name nihms-1710438-t0031.jpg 14%c <5 8ae graphic file with name nihms-1710438-t0032.jpg 1%b 1.7 ± 0.3
8o graphic file with name nihms-1710438-t0033.jpg 39%c 1.0 ± 0.3 8af graphic file with name nihms-1710438-t0034.jpg 0.3%b <1 μM
8p graphic file with name nihms-1710438-t0035.jpg 28%c 0.7 ± 0.1 8ag graphic file with name nihms-1710438-t0036.jpg 5%b 6.1 ± 2.6
a

Integrated area under OCR dose curve above baseline relative to that of BAM15 expressed as percent. NA = No Activity.

b

Highest tested concentration is 200 μM. BAM15 was tested up to 200 μM.

c

Highest tested concentration is 50 μM. BAM15 was tested up to 50 μM.