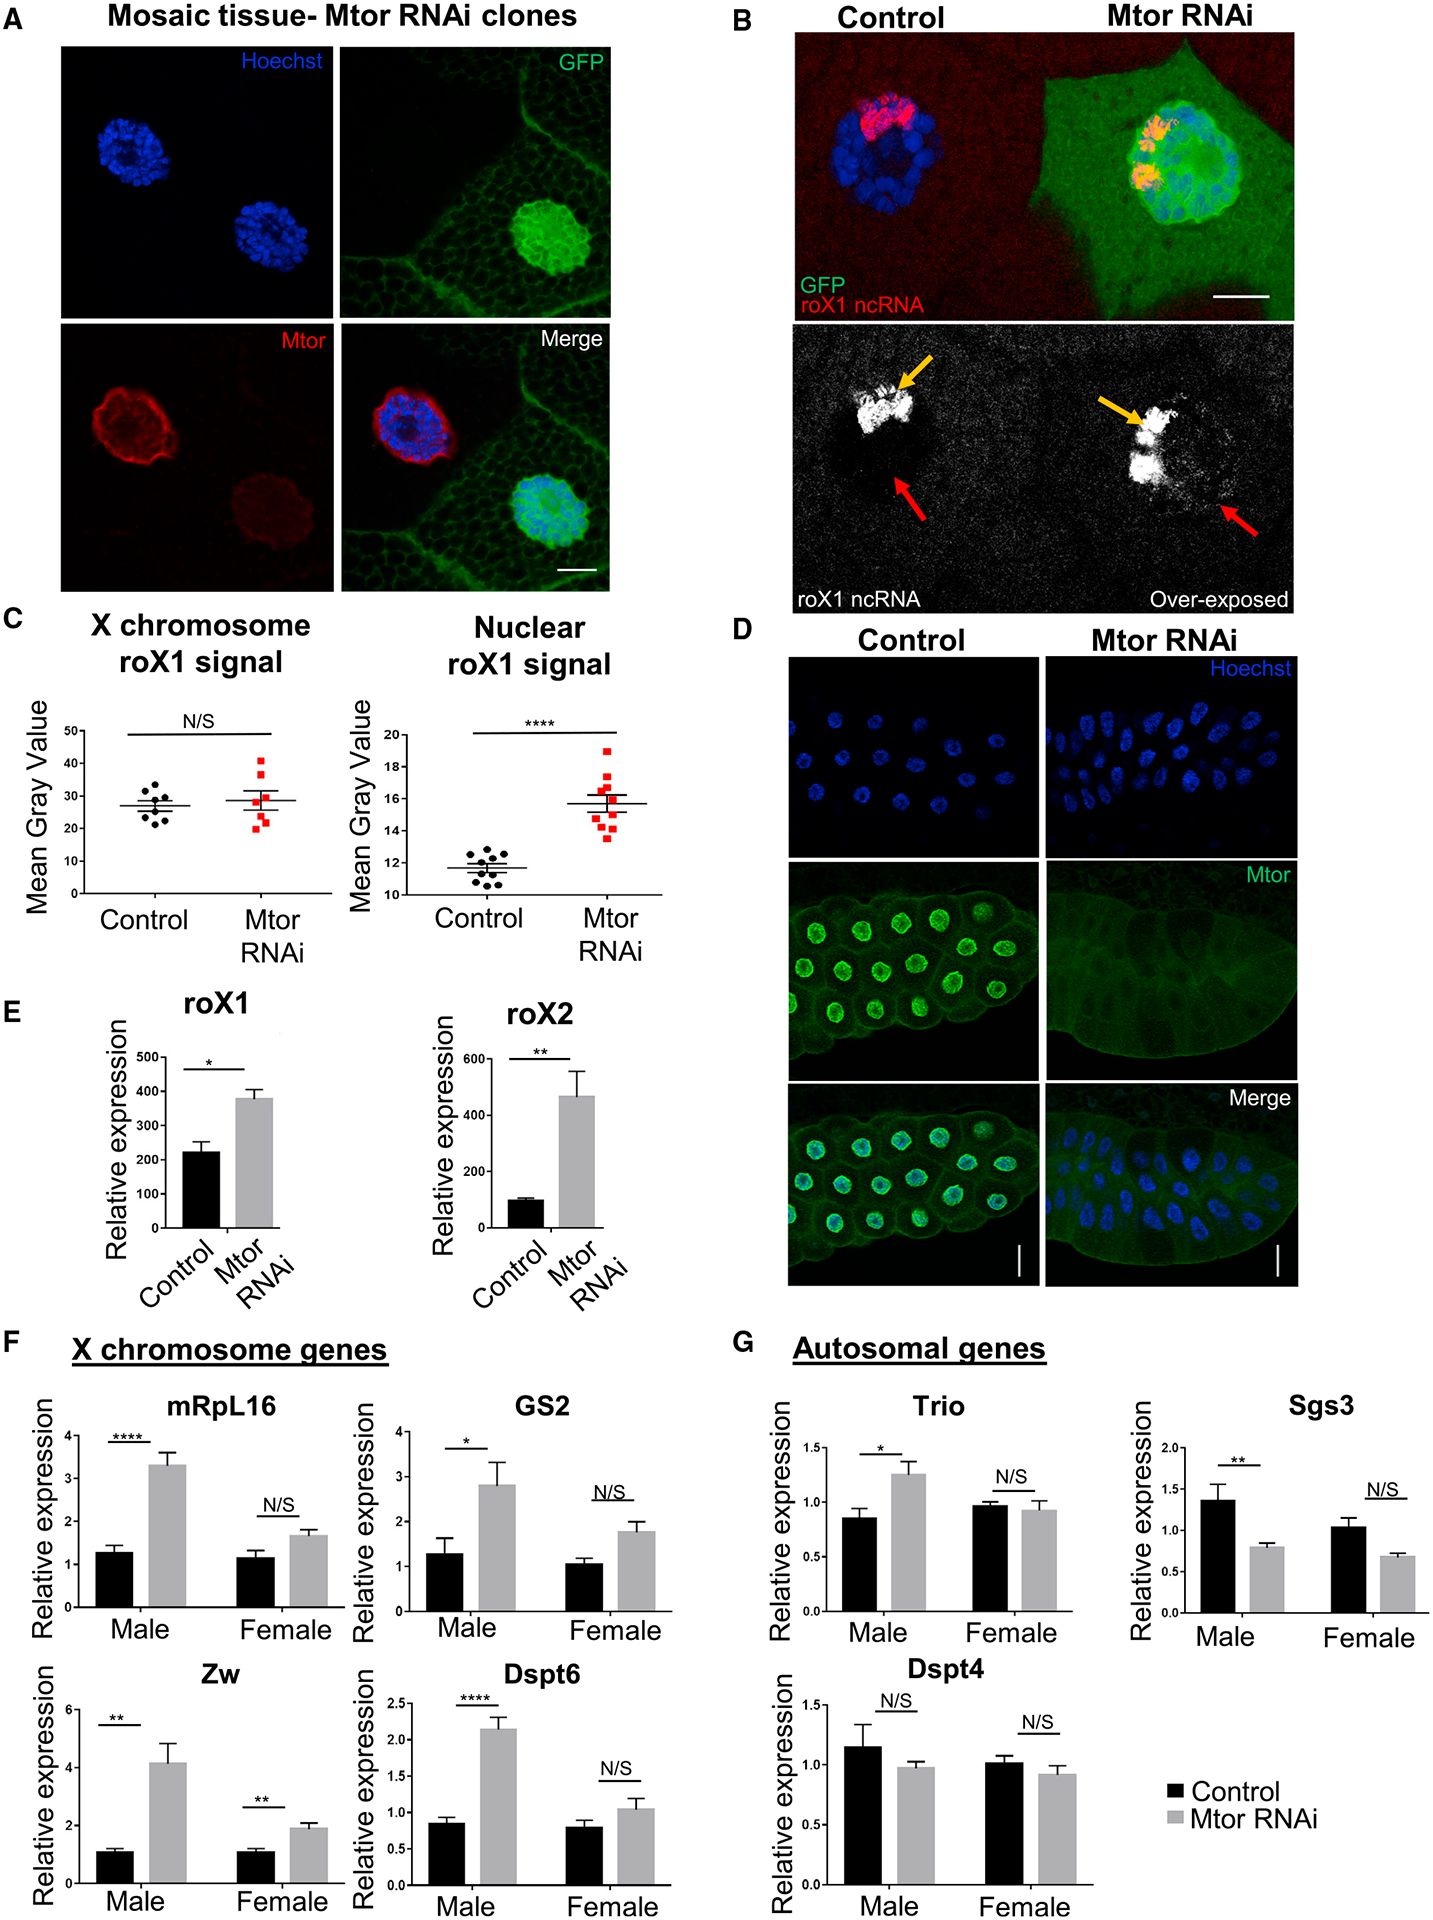
Figure 1. Loss of Mtor leads to overcompensation of X chromosome targets in Drosophila males.

(A) IF staining of larval salivary gland nuclei with Mtor RNAi mosaics. Mtor-depleted nucleus is marked with GFP. Antibodies are as labeled. Details on genetics are outlined in text and STAR Methods. Scale bar, 12 μm.
(B) SmRNA FISH for roX1 lncRNA (red or white) in GFP-marked Mtor RNAi mosaic salivary glands. The bottom panel shows roX1 overexposed to reveal X chromosome-localized roX1 (yellow arrow) and nuclear soluble roX1 (red arrow). Scale bar, 12 μm.
(C) Image quantification of X chromosome-localized and nuclear soluble rox1. N = 7–10 images from 2 animals. Error bars represent SEMs here and in the rest of the figure; ****p < 0.0001, N/S p > 0.05, using a paired t test.
(D) Salivary gland depletion of Mtor, induced by Nub-Gal4. Control or WT is the Nub-Gal4 stock for all experiments unless otherwise specified. Antibodies are as labeled. Scale bar, 45 μm.
(E) Expression levels of roX1 and roX2 from male salivary glands via qRT-PCR, normalized to rp49 (here and for all qRT-PCR). N = 4 biological replicates per condition, 10 glands per replicate. *p < 0.05, **p < 0.01, using an unpaired t test.
(F) Expression levels of X chromosome genes via qRT-PCR from control or Mtor KD male and female larval salivary glands, normalized to female controls. N = 6 biological replicates per condition, 10 glands per replicate. *p < 0.05, **p < 0.01, ***p < 0.001, ****p < 0.0001, N/S is p > 0.05, using 1-way ANOVA, followed by the Holm-Sidak test for multiple comparisons.
(G) Expression levels of autosomal genes via qRT-PCR from samples and with p values as described in (F).
