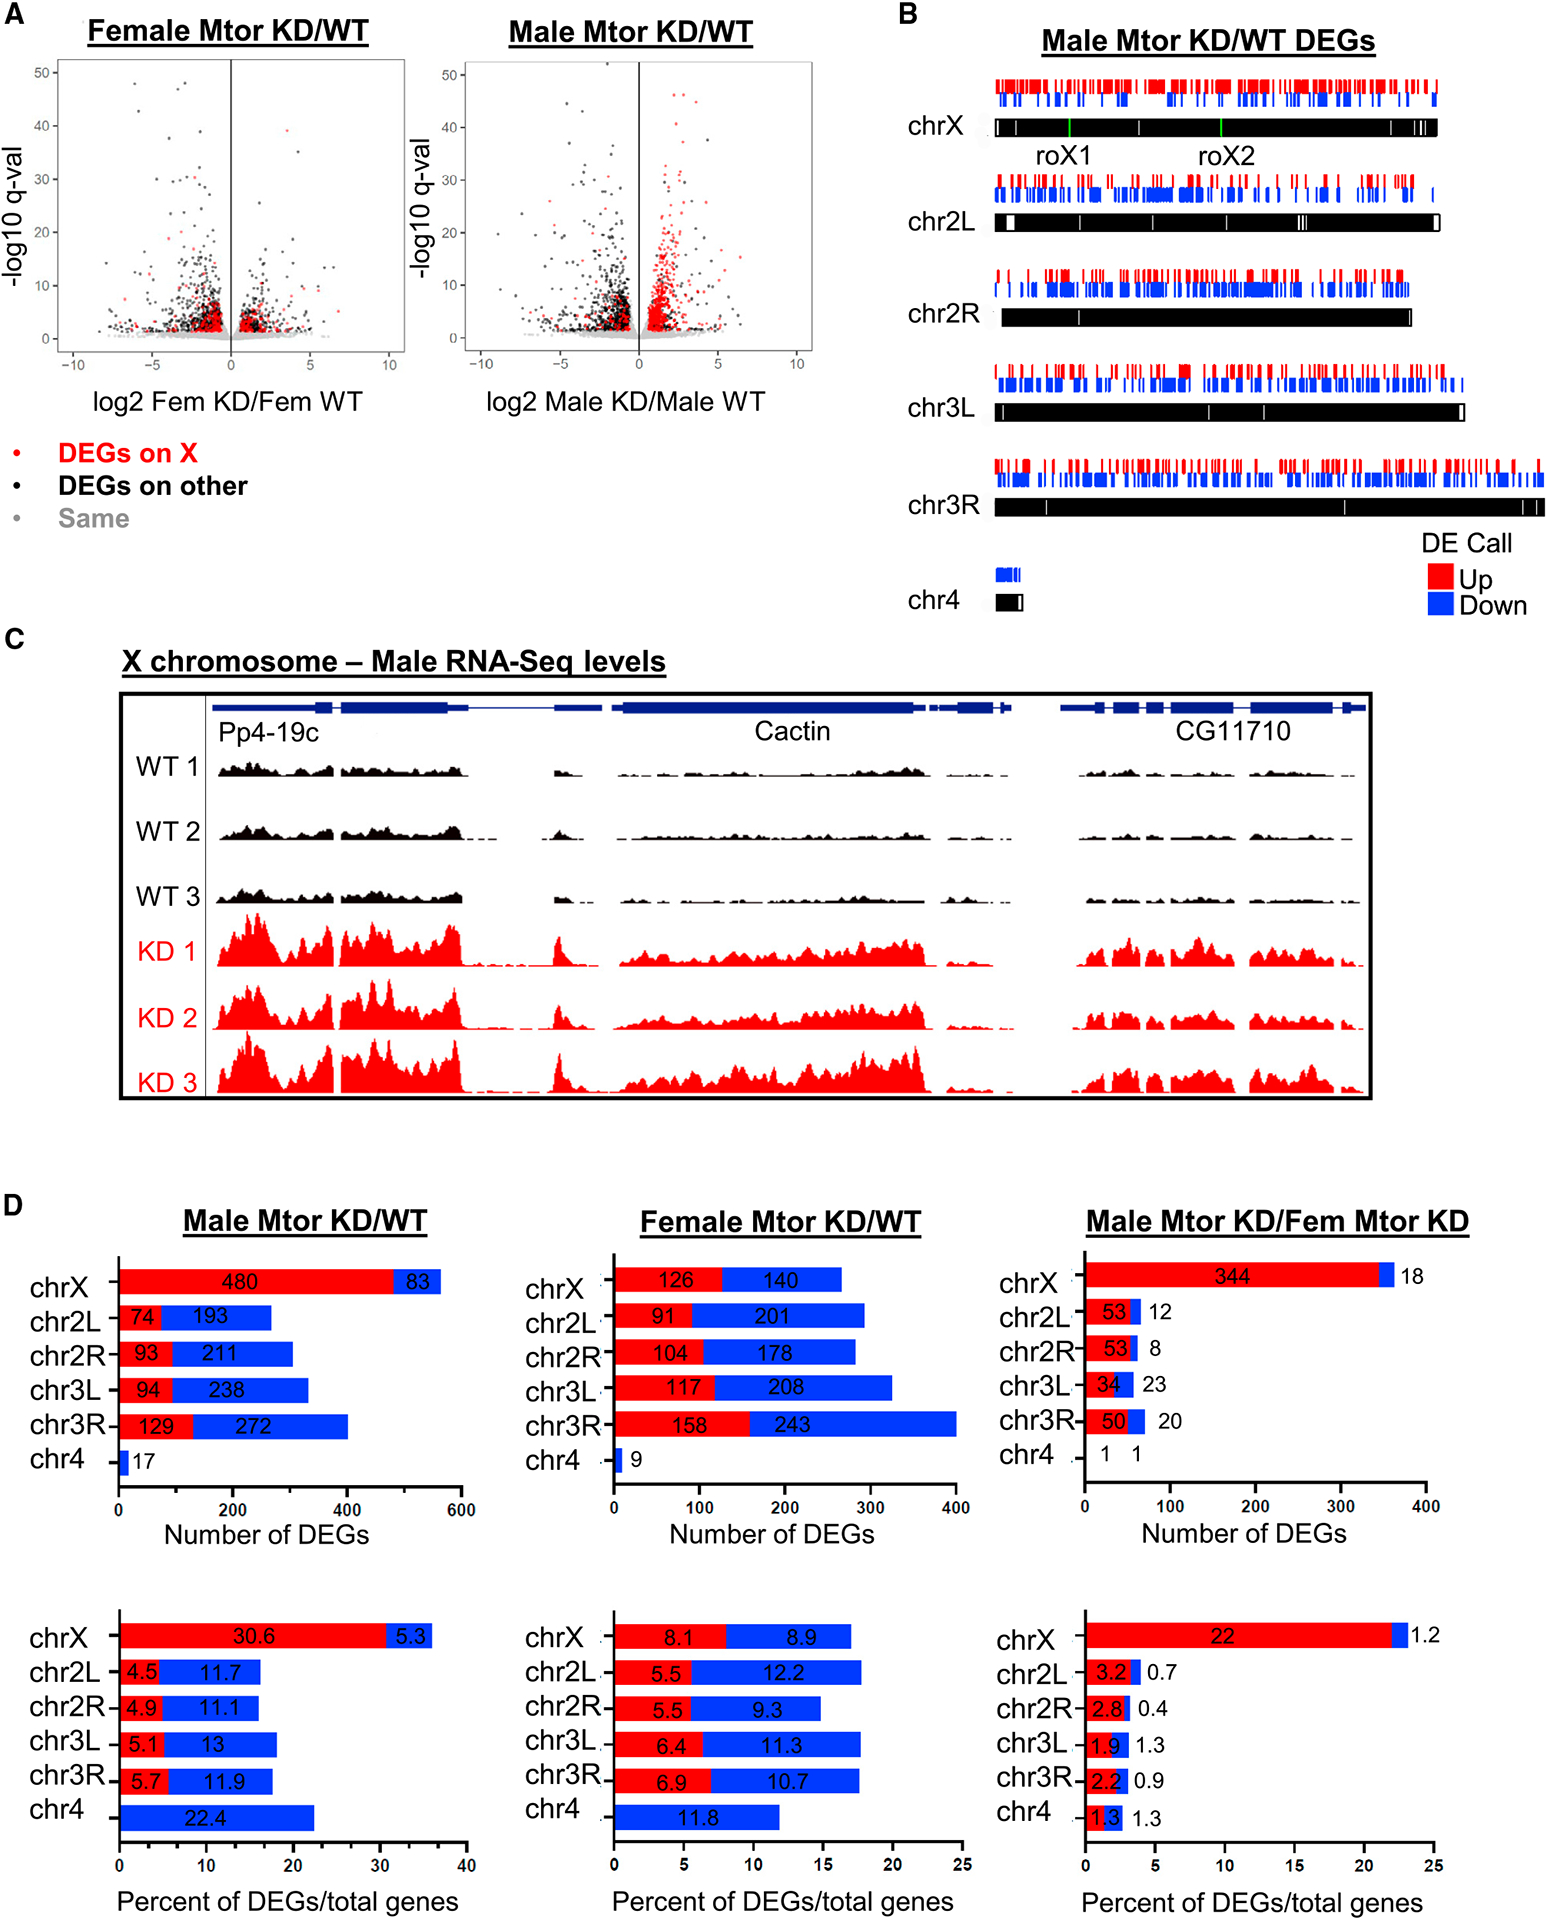
Figure 2. Depletion of Mtor results in selective upregulation of the male X chromosome.

(A) Volcano plot showing differentially expressed genes (DEGs) in females and males in salivary glands with Nub-Gal4-driven Mtor RNAi (KD) relative to WT controls, assessed by RNA-seq. Differential gene analysis was performed using DESeq2. Genes with a false discovery rate (FDR) < 0.05 and fold change > 1.5 were defined as DEGs.
(B) Genomic plot showing DEGs, obtained from RNA-seq, along chromosomes in males. roX1 and roX2 locations are labeled in green.
(C) Genome browser (GB) snapshot of RNA-seq reads in control and Mtor KD male replicates at an X-linked region. Displayed region is 9.1 kb and scale is 0–50.
(D) Numbers of DEGs per chromosome (top row) and percentages of DEGs out of total number of genes per chromosome (bottom row) in Mtor KD versus control males and females, as well as Mtor KD males versus females, obtained from RNA-seq analysis.
