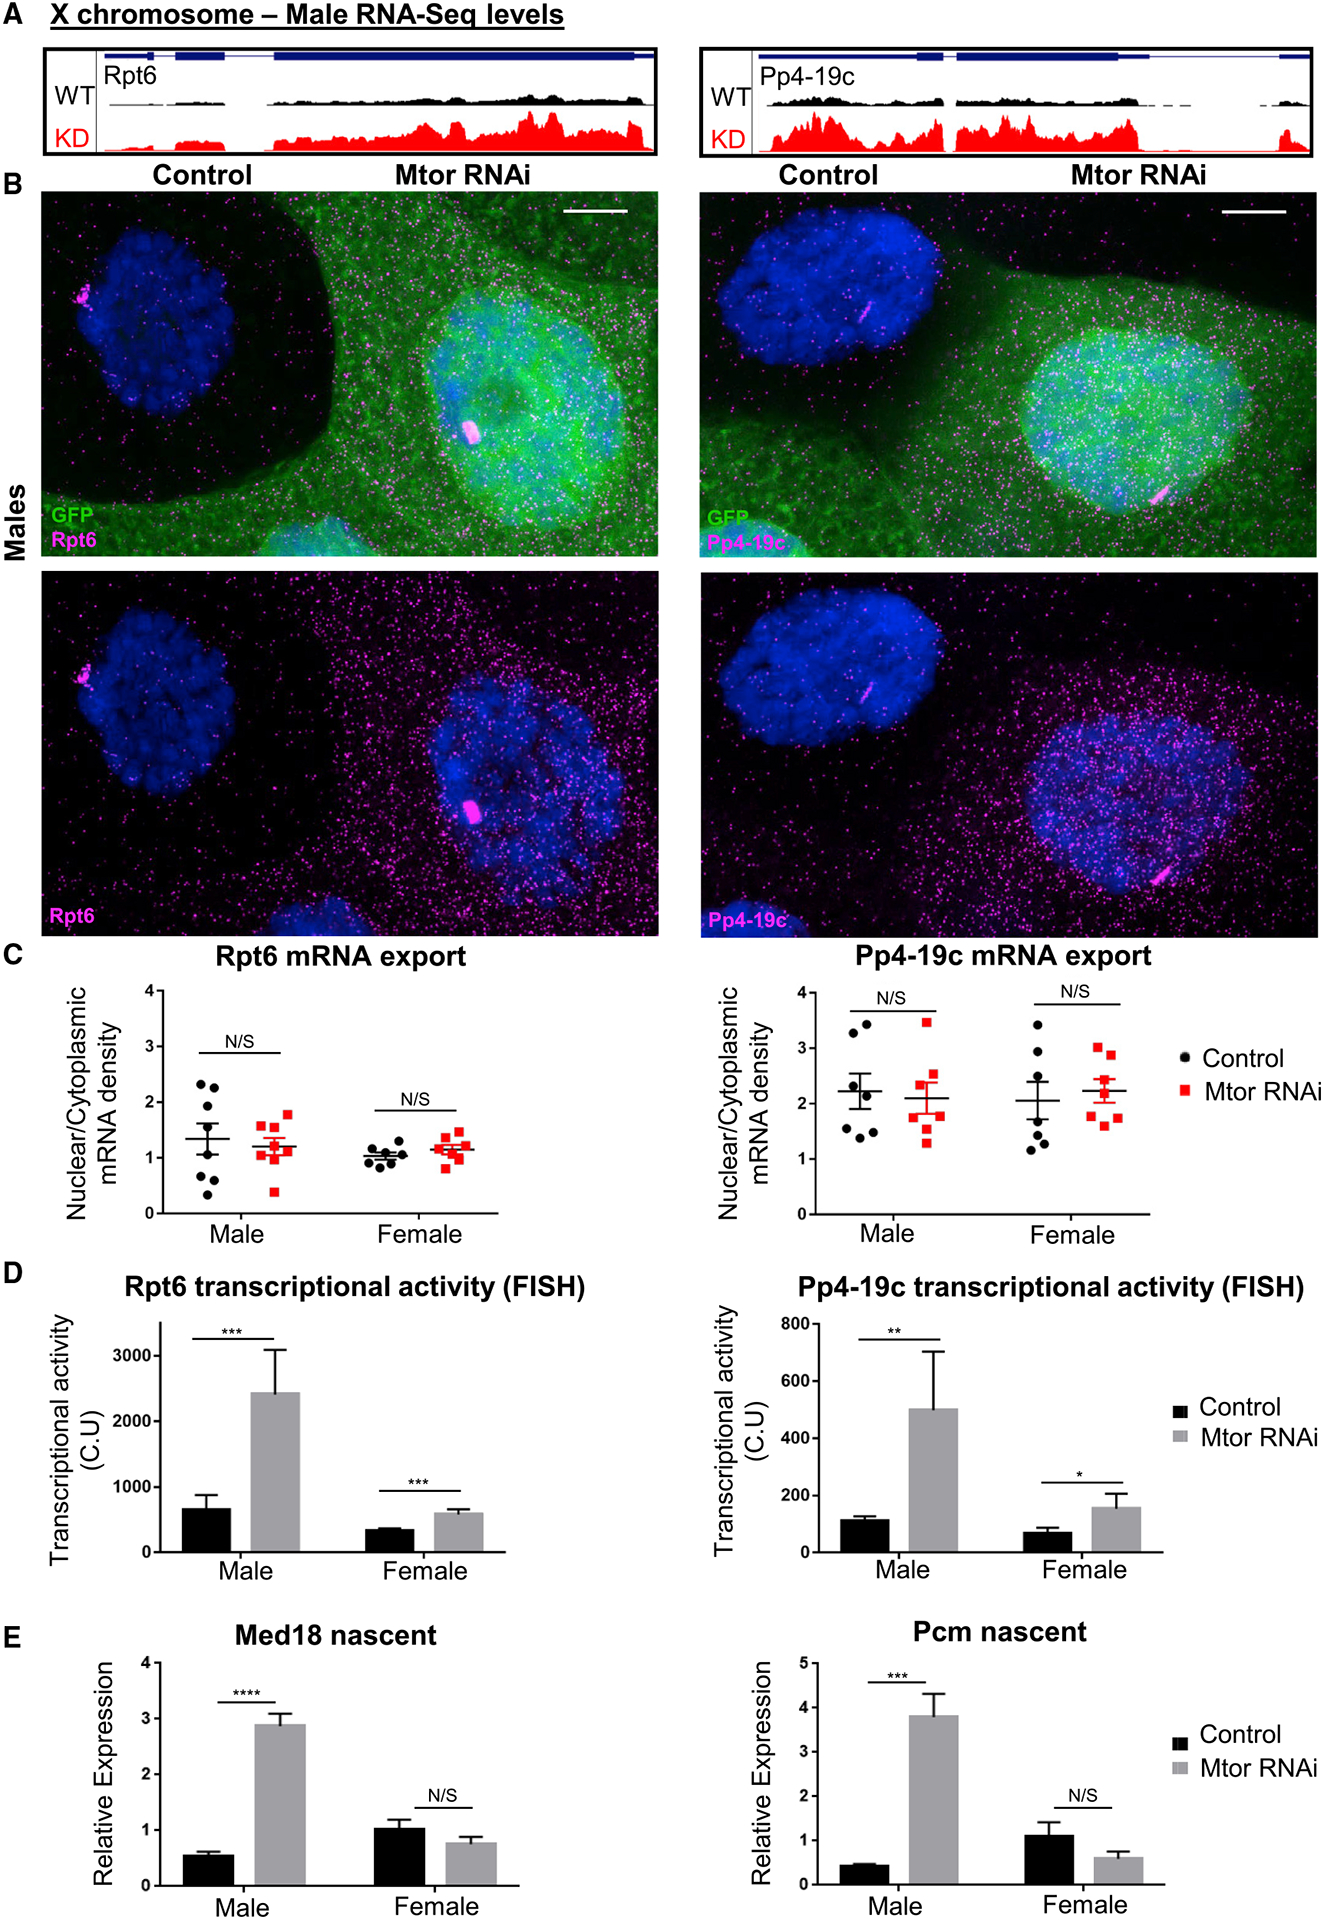
Figure 6. Upregulation of the male X upon depletion of Mtor occurs at the level of transcription and not via changes in mRNA export.

(A) GB snapshots of average RNA-seq levels at the X-linked genes selected for RNA FISH analysis, in control and Mtor KD males. The displayed region for Rpt6 is 1.6 kb and for Pp4-19c is 2.7 kb.
(B) SmRNA FISH for X chromosome targets Rpt6 and Pp4-19c in salivary gland nuclei from male larvae with induced Mtor RNAi mosaic system (GFP+ marks Mtor RNAi), as labeled and Hoechst in blue. Images are maximum projections spanning 5 μm. Scale bar, 12 μm.
(C) mRNA export quantification from smRNA FISH, as ratios of nuclear to cytoplasmic mRNA densities (see STAR Methods for details on image quantification). Each dot on each graph represents a single nucleus. N = 7–8, from 3 biological replicates each. Error bars represent SEMs. N/S is p > 0.05, using paired t tests.
(D) Quantification of nascent transcription site intensity in smRNA FISH. Transcriptional activity represented in CU (cytoplasmic units); see STAR Methods for details on quantification. N and error bars as in (C). *p < 0.05, **p < 0.01, and ***p < 0.001, using paired t tests.
(E) Nascent expression analysis via qRT-PCR of X chromosome targets in salivary glands of labeled genotypes (using exon-intron-spanning primers), normalized to female controls. N = 3 biological replicates, 10 salivary glands per sample. Error bars represent SEMs. ****p < 0.0001, N/S is p > 0.05, using a 1-way ANOVA, followed by the Holm-Sidak test for multiple comparisons.
