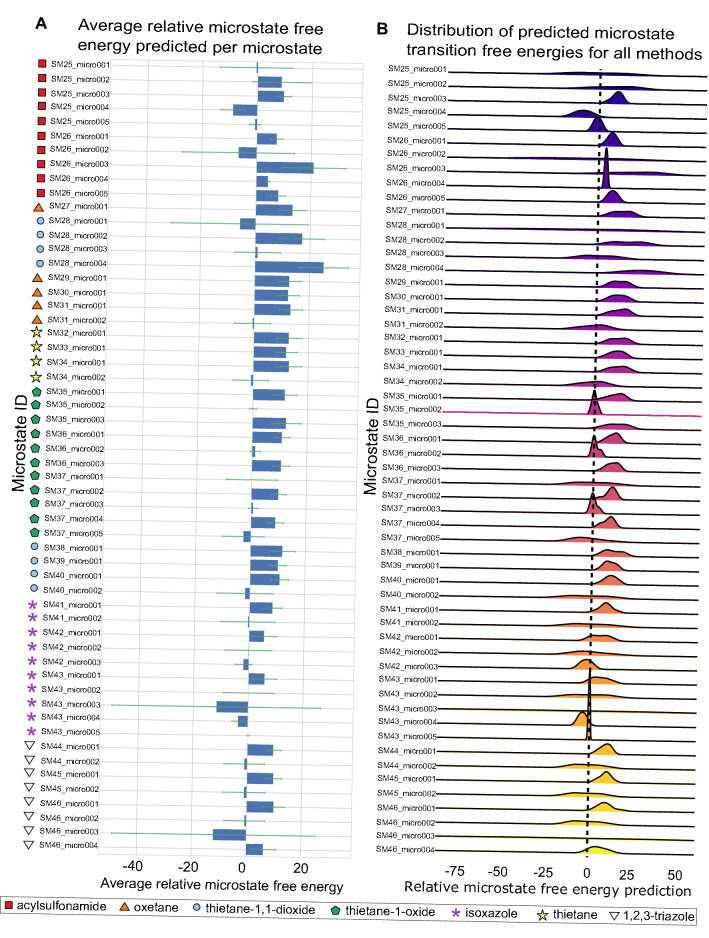
Fig. 12.
The average relative microstate free energy predicted per microstate and the distribution across predictions in the SAMPL7 pKa challenge show how varied predictions were. Molecules are labeled with their compound class as a reference. A The average relative microstate free energy predicted per microstate. Error bars are the standard deviation of the relative microstate free energy predictions. A lower standard deviation indicates that predictions for a microstate generally agree, while a larger standard deviation means that predictions disagree. Predictions made for microstates such as SM25_micro001, SM26_micro002, SM28_micro001, SM43_micro003, SM46_micro003 widely disagree, while predictions for microstates such as SM26_micro004 are in agreement. B Distribution for each relative microstate free energy prediction over all prediction methods shows how prediction agreement among methods varied depending on the microstate

