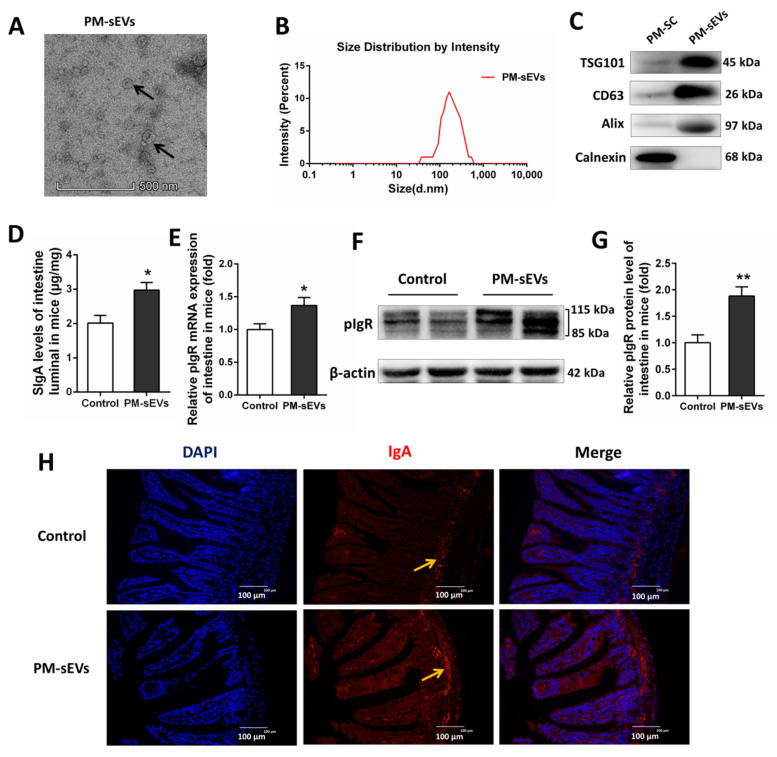
Figure 1.
Identification of PM-sEVs and effect of PM-sEVs on intestinal SIgA levels in mice. (A) Morphology of PM-sEVs visualized under TEM. Scale bar: 500 nm. The arrows indicate “PM-sEVs”. (B) Size distribution analysis of PM-sEVs. (C) Western Blotting analysis of porcine milk somatic cell (PM-SC) and PM-sEVs. Milk SC and PM-sEVs were blotted for commonly used sEVs markers TSG101, CD63, and Alix and the endoplasmic reticulum marker Calnexin. (D) ELISA analysis of SIgA levels of intestinal luminal contents in mice (n = 8). (E) qRT-PCR analysis of pIgR mRNA expression levels of intestinal tissue in mice (n = 8). (F,G) Western Blotting analysis of pIgR protein level of intestinal tissue in mice (n = 4). (H) Intestine of mice was sectioned for immunofluorescence staining (Scale bar = 100 μm) to analysis the level of IgA (n = 4). All data are presented as means ± SEM. * p < 0.05; ** p < 0.01.

