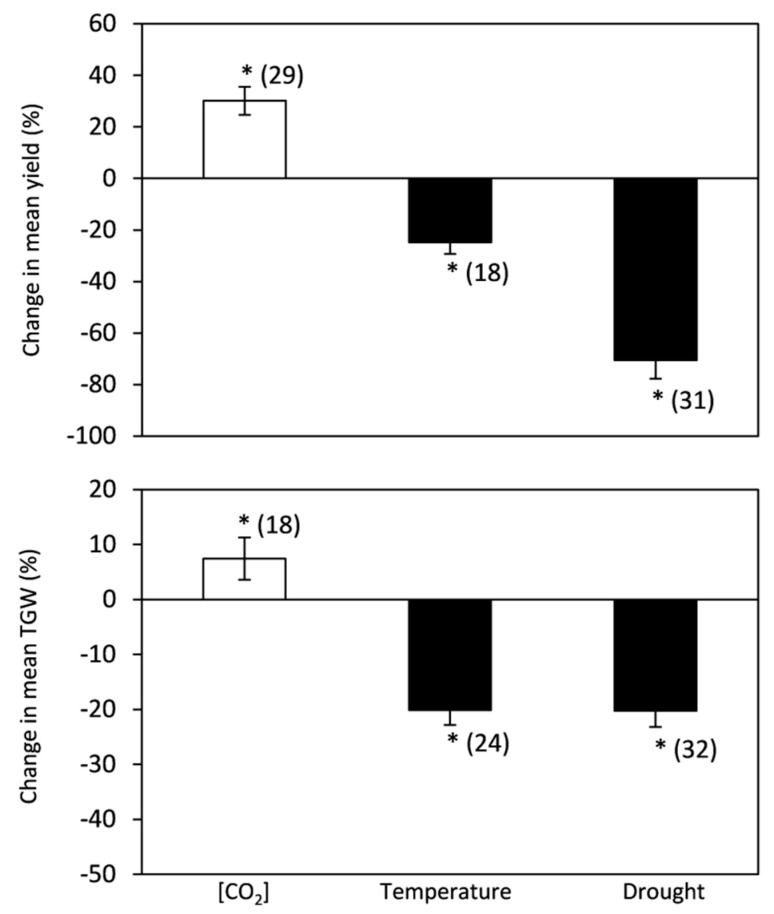
Figure 1.
Change (%) in the mean of yield and TGW of plants grown under elevated [CO2], high temperature, and drought stress relative to the control. Data within parentheses indicate the number of observations. Error bars indicate the standard error of the mean. * indicates a statistically significant difference at p < 0.05.

