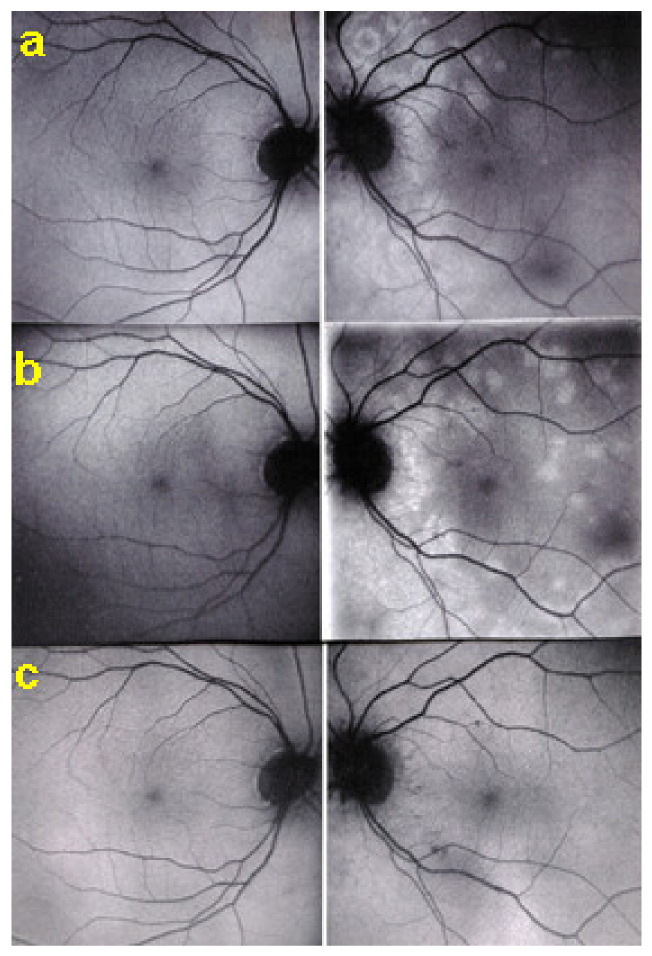
Figure 21.
BAF pictures of MFC at presentation (a), after 1 month (b), and 4 months (c). On the right column of pictures (left eye), hyperautofluorescent areas corresponding to the FA and ICGA lesions can be seen at presentation (a) which, on the (b), have slightly progressed at one month with return to almost normal autofluorescence after 4 months (c). BAF delineates lesions even with more precision than ICGA.

