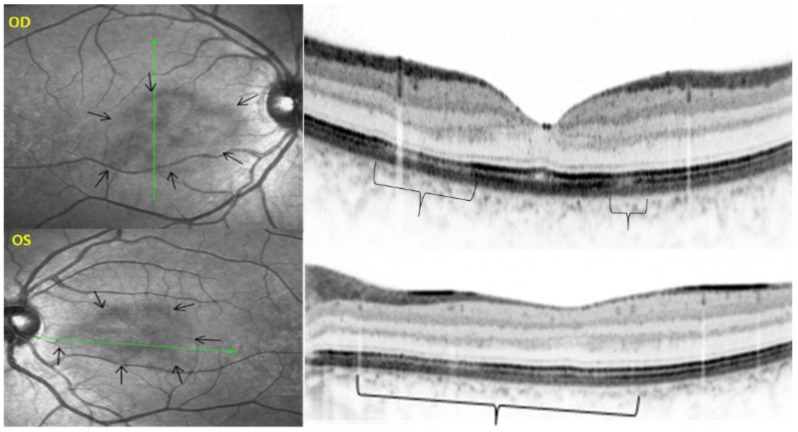
Figure 32.
AMN. NIR-R, SD-OCT, FAF, FA, and ICGA images at first presentation. NIR-R and SD-OCT images: NIR-R imaging shows hyporeflective petal-like oval areas in the macular region (arrows) in corresponding on SD-OCT to a reduction of the signal of the IZ (brackets). In OD, the reduction of the signal is limited to two segments of the outer retina, while in OS, it comprises the whole outer retinal section corresponding to the hyporeflective infrared lesion.

