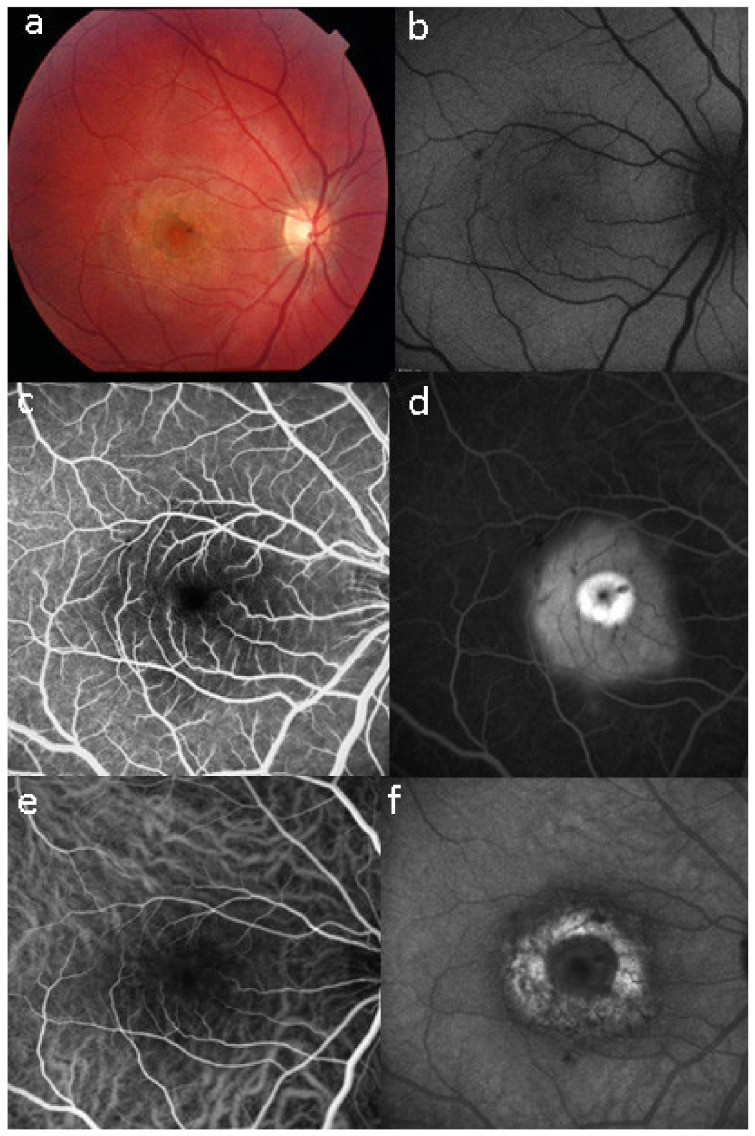
Figure 35.
Images of a case of UIAM a week after the onset of symptoms. (a) fundus photography showing well-circumscribed area of RPE atrophy and hyperplasia. (b,c) BAF and NIR-FAF show stippled hyperautofluorescence, more evident in NIR mode, indicating increase not only of lipofuscin but especially of melanin and compounds closely related to melanin. (d) FA in the late phase shows hyperfluorescence (staining). (e,f) ICGA early and late phases reveal only in the late phase of the angiography a large area of hypofluorescent dark area, sign of choriocapillaris ischaemic non-perfusion.

