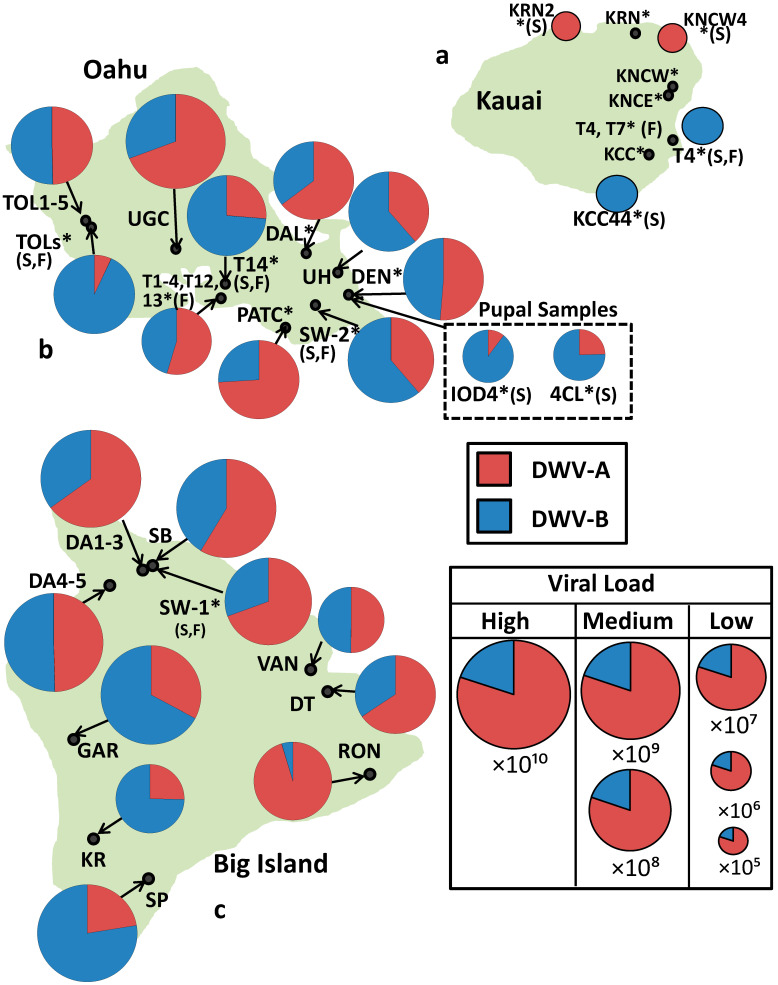
Figure 1.
(a–c). Islands showing proportions of DWV-A RdRp (red) and DWV-B RdRp (blue) in each apiary (* = A colony that is not chemically treated for Varroa, S = Sample(s) came from a single colony, F = feral). The size of each pie chart is relative to the median total DWV genome equivalents per apiary.

