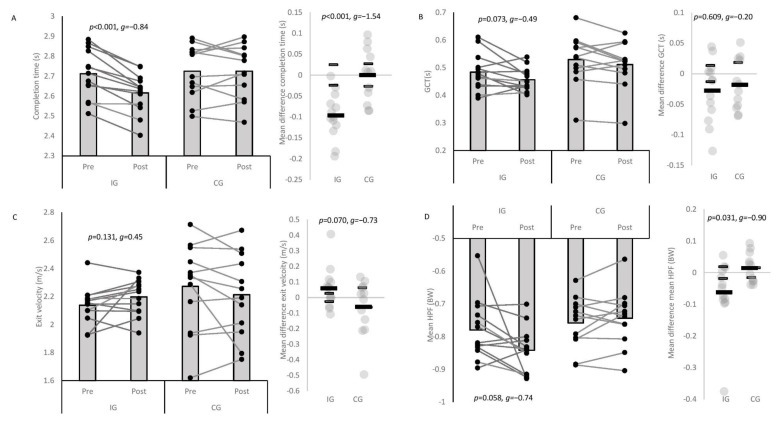
Figure 2.
Pre-to-post-changes in mod505 performance variables with individual plots (connected lines). (A) Completion time; (B) GCT; (C) exit velocity; (D) mean HPF; IG: intervention group; CG: control group; GCT: ground contact time; HPF: horizontal propulsive force; grey column bars denote mean. Black rectangle denotes mean difference (pre-to-post-change). Smaller grey rectangles indicate smallest worthwhile change; thus, individual changes which exceed these are considered a positive or negative responder, and changes less than the smallest worthwhile change indicate a non-responder.

