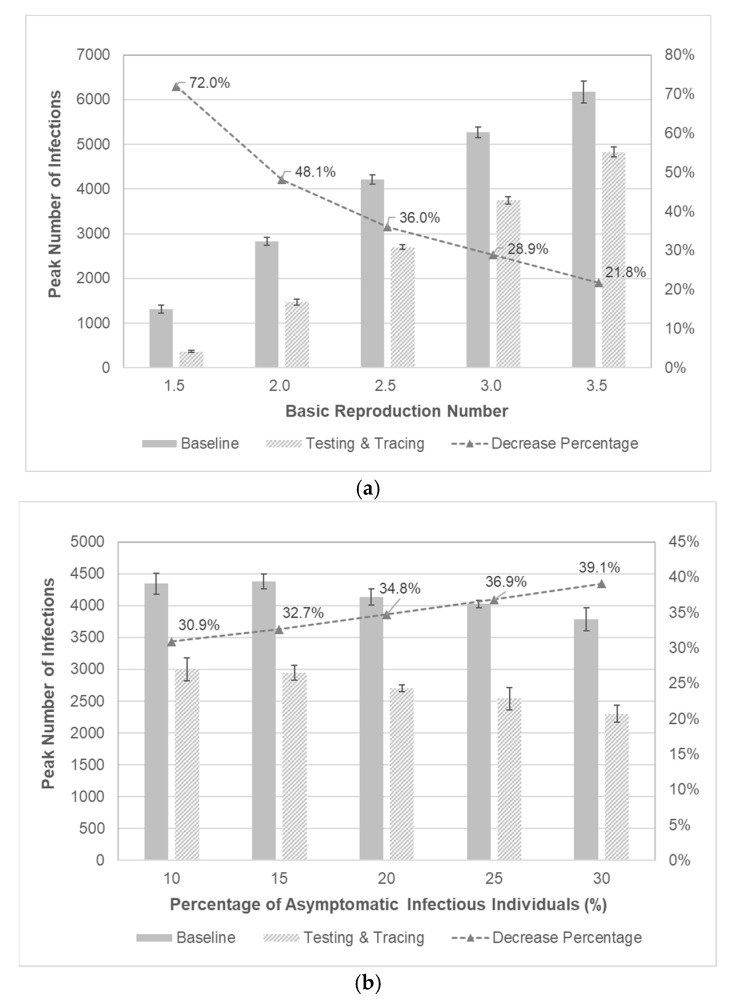
Figure 8.
Sensitivity analysis with respect to epidemiological parameters. (a) Comparison of peak number of infections with respect to . The 95% confidence intervals are represented as bar graphs at each point. (b) Comparison of peak number of infections with respect to the percentage of asymptomatic infectious individuals. The 95% confidence intervals are represented as bar graphs at each point.

