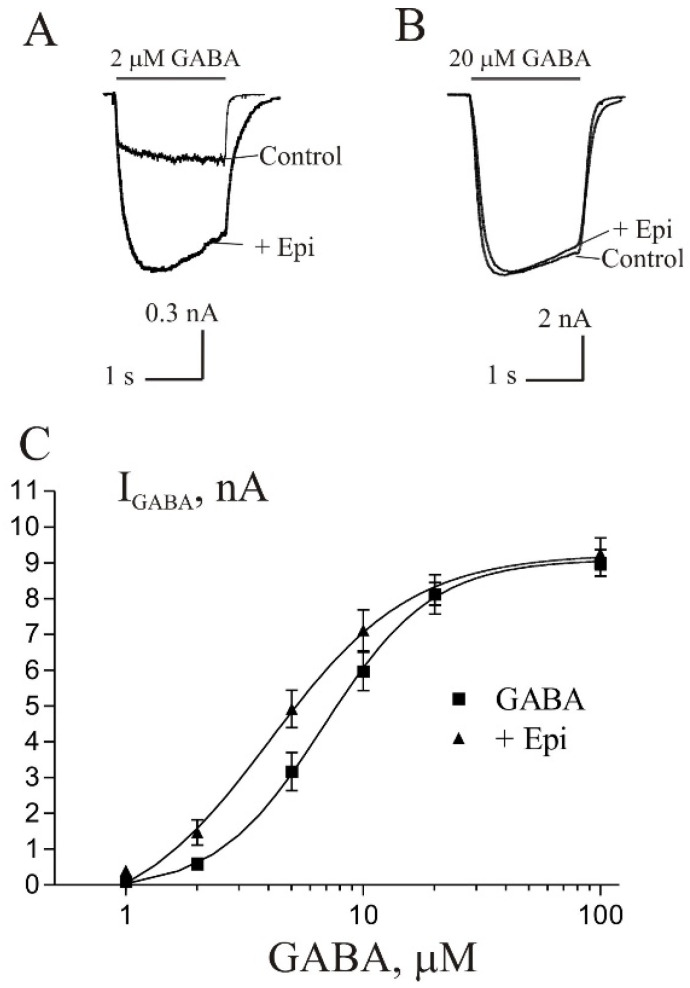
Figure 4.
The degree of Epi effect depends on GABA concentration. (A,B) Representative traces of current induced by 2 µM GABA (A) and 20 µM GABA (B) in control and during co-application with 10 µM Epi. (C) Concentration–response curves for GABA obtained in control (squares) and in the presence of 10 µM Epi (triangles). Data points represent an average from six cells.

