Figure 1.
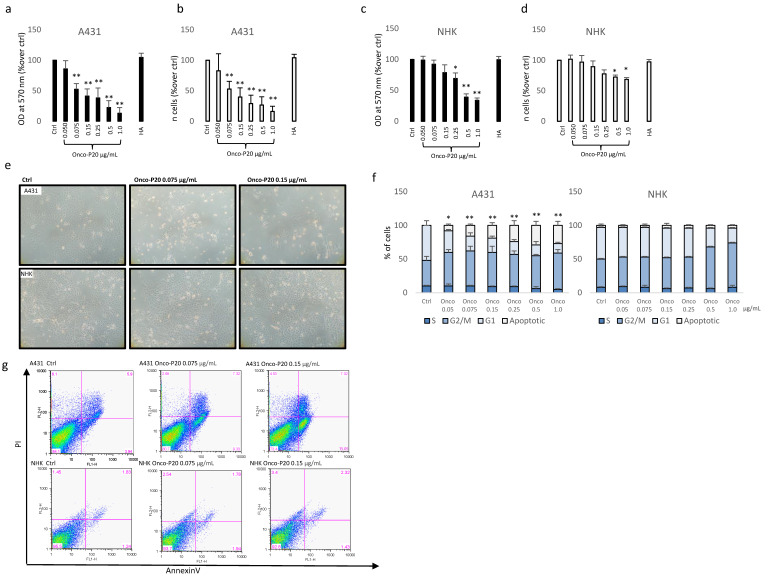
MTT assay (a) and cell count (b) of A431 cells treated (72 h) with increasing concentrations of Onco-P20 (range 0.05–1.0 μg/mL) or HA 1.0 μg/mL, equivalent to the HA concentration at the higher doses of Onco-P20. Data are reported as optical density (OD). Data represent the mean ± SD of three independent experiments performed in duplicate. MTT assay (c) and cell count (d) of NHKs treated (72 h) with increasing concentrations of Onco-P20. Histograms represent the mean ± SD of three NHK cell lines isolated from different donors. (e) Microscopic images of normal and carcinoma cells after 72 h of treatment with Onco-P20. (f) Cell cycle distribution of Onco-P20-treated normal and carcinoma cells. (g) Apoptosis was evaluated by FACS analysis using annexin V/iodide propidium staining. Dot plots show one representative experiment performed 24 h after Onco-P20 treatment. Statistical significance versus untreated control is reported as * p < 0.05 and ** p < 0.001. In the case of (g), statistical significance represents the difference of apoptotic cells in A431 versus NHKs.

