Figure 2.
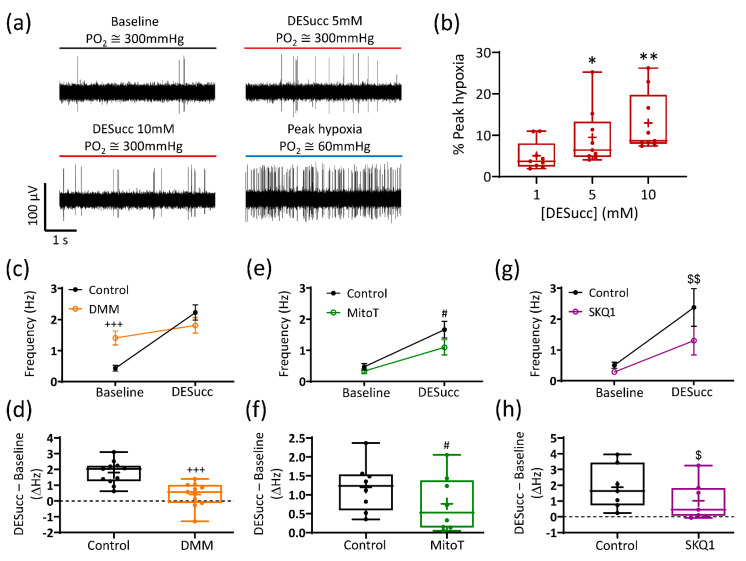
The carotid body (CB) response to succinate is dependent on mitochondrial complex II activity and reactive oxygen species generation. (a) Example 5 s raw CB chemoafferent recordings from the same fibre comparing activity in the presence of diethyl succinate (DESucc—5 and 10 mM) with peak hypoxia. (b) Mean responses to 1, 5, and 10 mM DESucc as a percentage of peak hypoxia (n = 9 fibres, N = 4 animals). * and ** denote p < 0.05 and p < 0.01 vs. 1 mM, one-way repeated measures ANOVA with Dunnett’s post hoc test. (c,d) Absolute and changes in frequency caused by 5 mM DESucc ± 10 mM dimethyl malonate (DMM), respectively (n = 11 fibres, N = 5 animals). (e,f) Absolute and changes in frequency caused by 5 mM DESucc ± 20 µM MitoTEMPO (MitoT), respectively (n = 8 fibres, N = 6 animals). (g,h) Absolute and changes in frequency caused by 5 mM DESucc ± 1 µM SKQ1, respectively (n = 6 fibres, N = 5 animals). For (c,e,g), data presented as mean ± SEM. +++ p < 0.001 control vs. DMM, # p < 0.05 control vs. MitoT, $$ p < 0.01 control vs. SKQ1, two-way ANOVA with Tukey post hoc test. For (d,f,h), data presented as box-whisker plots with median, mean (shown as +), the box representing the interquartile range and the whiskers extending to outliers. Single points represent individual fibres. +++ p < 0.001 control vs. DMM, # p < 0.05 control vs. MitoT, $ p < 0.05 control vs. SKQ1, paired t-test.

