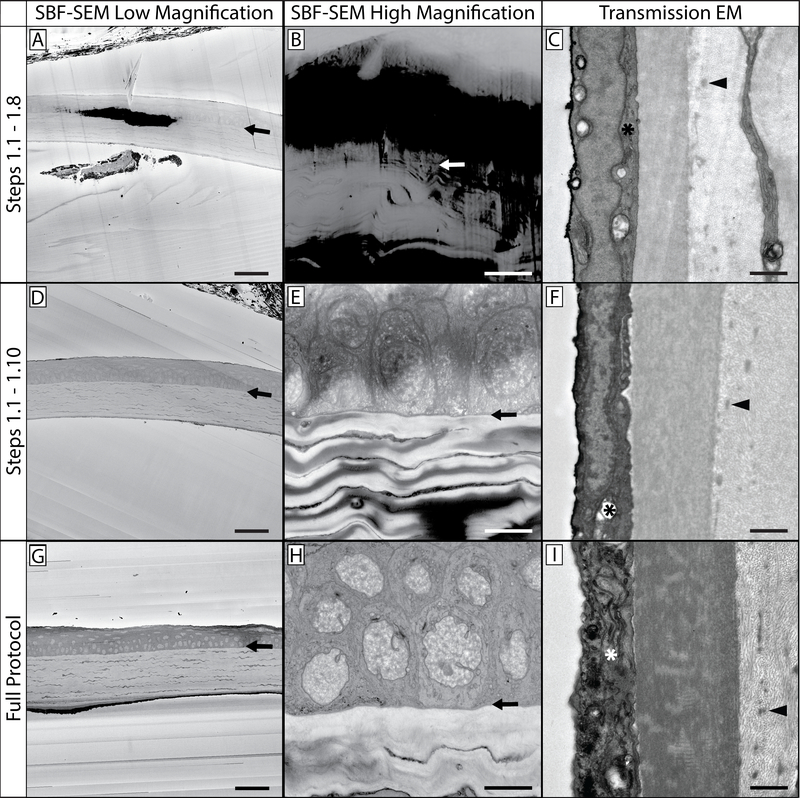
Figure 1: SBF-SEM and TEM comparisons at various steps in the protocol.
This protocol contains multiple steps in which sample tissue is stained with heavy metals. This affects not only tissue contrast and appreciation of cellular structures and organelles, but also the levels of charging that occurs when the tissue is imaged. This figure contains three distinct views of prepared tissue: a low magnification view (A, D & G), a high magnification view (B, E & H), and a TEM comparison of prepared mouse cornea (C, F & I). It can be noted that higher magnification images can result in increased tissue charging, as the electron beam is concentrated in a smaller region of tissue. The top row (A-C) is a representative sample from tissue processed through the completion of step 1.8, and has been impregnated with potassium ferrocyanide, osmium tetroxide, and thiocarbohydrazide. The arrows in the first two columns show the epithelial-stromal interface as a reference point. Note the low level of contrast in comparison to the bottom two rows, as well as the increased levels of tissue charging. The sample in the middle row (D-F) was processed through the completion of step 1.10 and benefits from an additional osmium tetroxide step, and is visibly more contrasted than the sample in the top row. While cellular structures are discernible, charging is still present. The sample in the bottom row (G-I) benefits from the full staining protocol and has minimal tissue charging. TEM imaging reveals tissue contrast levels imparted by the heavy metals present at each step (right column): organelles in the corneal endothelium (*) are more contrasted and apparent as tissue processing continues through the protocol. Additionally, stromal collagen and fibrillin details become more visible (arrowhead) as the protocol is completed. Panel A, D & G scale bar = 50 μm. Panel B, E & H scale bar = 10 μm. Panel C, F & I scale bar = 1 μm.

