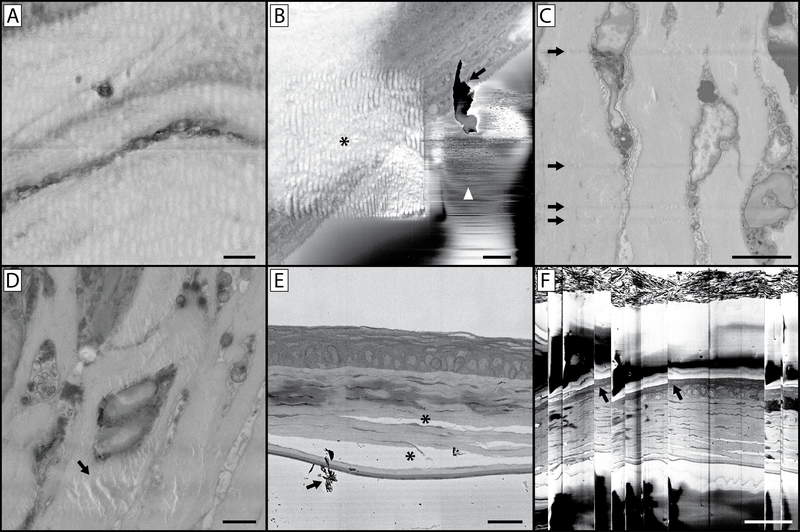
Figure 10: Imaging complications and artefacts.
(A) The wavy and distorted nature of this image is the result of imaging using a pixel dwell time that is too long. This heats the resin block, leaving the block face soft and rubbery which results in a distorted image upon cutting. (B) This image contains a host of artefacts. The asterisk indicates a wavy distortion caused by prior imaging at a higher magnification and similar to panel A, concentrating the beam on a smaller region with a longer pixel dwell time has softened the resin in this region of interest. While the higher magnification image collected was free of artefacts, this can lead to a subsequent series of images where the sample underlying the region of interest appears distorted. This panel also illustrates the issue of debris accumulation on the block face (arrow) during imaging, also denoted by the arrow in panel E. If this becomes a persistent imaging problem, it will be necessary to break the vacuum, open the chamber and blow away debris accumulated on the diamond knife and around the sample. Small discharges of electrons from the block-face can lead to the rapid contrast changes and lines denoted by the white arrowhead. (C) This image illustrates knife scratches on the block face. This can occur due to a damaged knife, or debris accumulation on the edge of the knife. (D) The artefact denoted (arrow) is a result of the electron beam focused on (without sectioning) the block face for an extended period of time with the sample still in the imaging chamber. (E) Improper fixation of tissue can lead to separation of cellular structures and connective tissue (*). (F) If a large amount of charging occurs in your tissue or resin block, subsequent accumulation and discharge can occur which leads to the image “skipping” as is seen in this image. Note the distortion of the tissue in the image at these skipping points (arrows). Panel A scale bar = 1 μm. Panel B scale bar = 2 μm. Panel C scale bar = 5 μm. Panel D scale bar = 2 μm. Panel E scale bar = 25 um. Panel F scale bar = 50 um.

