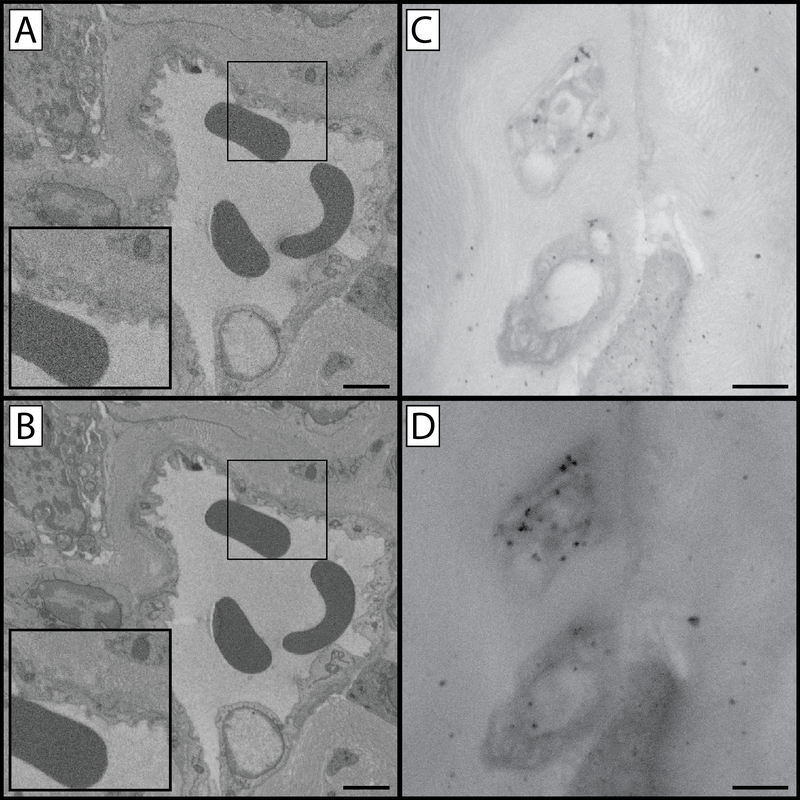
Figure 3: Comparison of image capture settings.
(A & B) Panels A and B compare image quality and resolution as a function of pixel dwell time. Panel A was created using a 32 μs/pixel dwell time at 4 kV and suffers from a diminished signal to noise ratio as is apparent in the “grainy” appearance of the enlarged inset. Panel B was created using a 100 μs/pixel dwell time at 4 kV. Increasing the pixel dwell time increases the signal to noise ratio and reveals an increased level of cellular detail, however increased pixel dwell time has the potential to lead to tissue charging and/or heat build-up which softens the block and introduces cutting artefacts (chatter) when sectioning. Panels C and D compare images captured under identical exposure conditions but with two different beam kV values. Tissue in these panels was impregnated with gold-toned nanogold particles to make differences in beam-penetration depths more apparent. Panel C was captured at 9 kV while panel D was captured at 21 kV. Increased kV has the advantage of increased contrast (D), however details are lost as result of gathering electrons from a greater depth of tissue (C). As a result of sampling a larger cross section, larger numbers of immunogold particles specific for GAP 43 are visible while non-specific labeling remains the same resulting in an increased signal-to-noise ratio. Panel A & B scale bar = 2 μm. Panel C & D scale bar = 1 μm.

