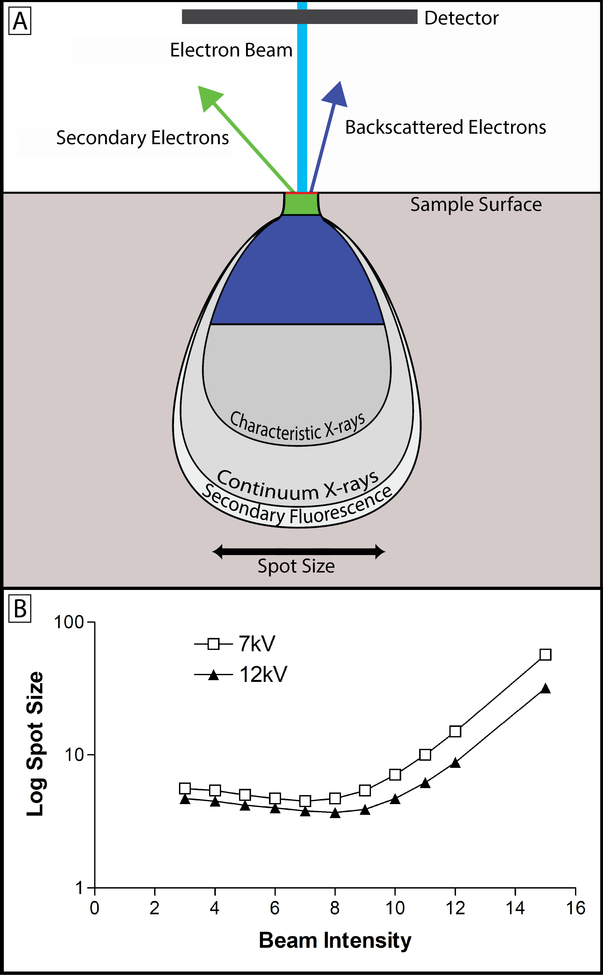
Figure 4: Beam intensity, kV and spot size.
(A) Upon contacting the tissue sample, the electron beam (light blue) yields a teardrop-shaped interaction volume, from which varying forms of energy are produced from the interaction between beam electrons and the tissue sample. The teardrop shape is a function of tissue density and heavy metal staining along with beam energy, and the tilt angle of the electron beam43. While x-rays, auger electrons, and tertiary electrons are produced during SBF-SEM imaging, the primary concern is with backscattered (dark blue) and secondary (green) electrons13. The image produced with SBF-SEM imaging is produced by collecting backscattered electrons. These electrons originate from elastic interactions between the beam and the sample, and the signal collected is highly dependent on the atomic number of atoms interacted with – hence the need for heavy metal staining44. Secondary electrons originate from inelastic interactions between the beam and the sample and detection of their signal is highly dependent on surface orientation. Because the block-face is flat in SBF-SEM, secondary electrons do not contribute meaningfully to the signal collected13. In fact, secondary electron accumulation on the surface of the block can be a major source of charging and has a deleterious effect on image quality2. (B) This graph shows the relationship between beam intensity, beam kV, and spot size. The spot size is the spatial resolution of the beam, and determines the resolution limit of the images being produced. Lowering kV increases the spot size, but also decreases the imaging depth allowing for finer appreciation of detail. This has the effect of decreasing the detectable signal as well. Increasing beam intensity offers an initial improvement on spot size and signal detection, but rapidly increases levels of tissue charging. Ultimately, the beam intensity and kV values chosen are sample dependent and best determined empirically in relation to the scientific question being asked.

