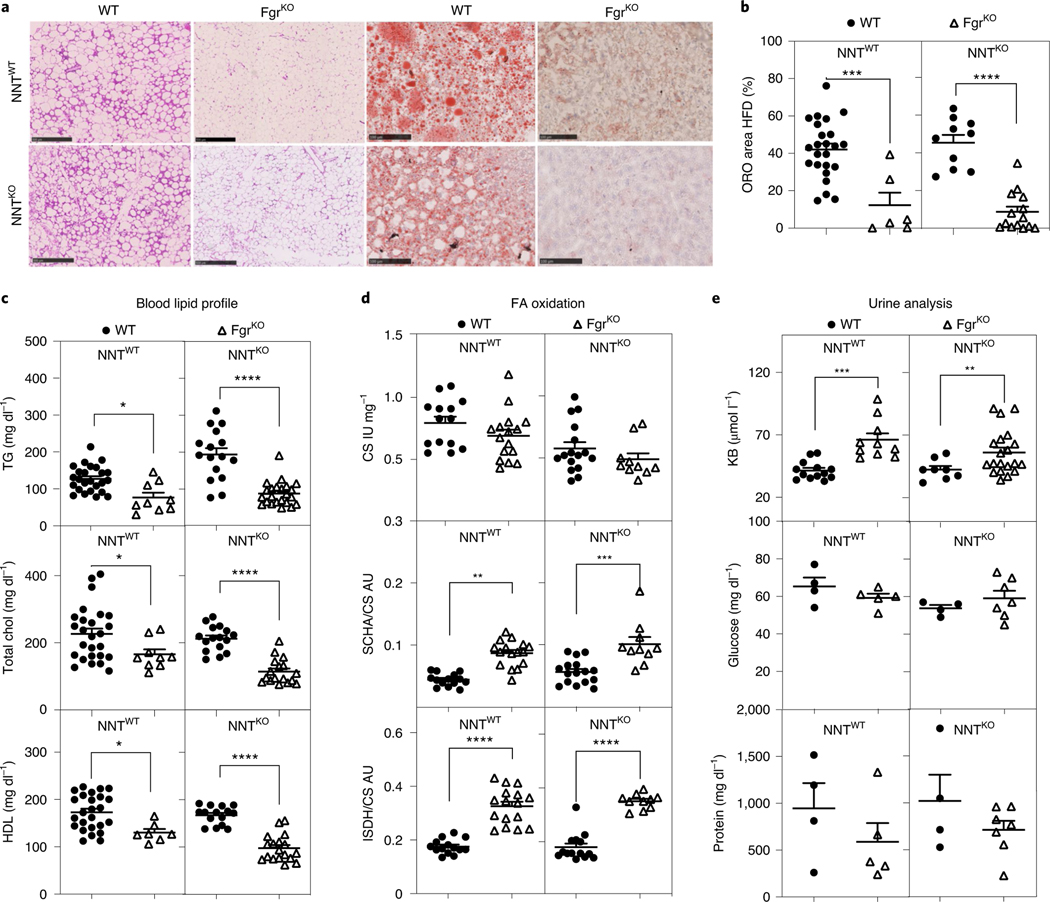
Fig. 4 |. Lack of Fgr prevents liver steatosis through increased FAO in a HFD.
a, Representative haematoxylin and eosin (H&E) staining of WAT paraffin sections of the indicated genotypes in a HFD (left); scale bars: 500 μm. Representative Oil red O (ORO) staining of OCT-embedded liver sections of the indicated genotypes in a HFD (right); scale bars: 100 μm. b, Quantification of ORO-positive stained area versus total liver area in OCT liver sections of the indicated genotypes in the HFD group (n = 6). c, Serum lipid profile for triglycerides (TG; upper), total cholesterol (Chol; middle) and HDL (bottom) in WT and FgrKO mice in the NNTWT or NNTKO background fed a HFD for 8 weeks (NNTWT background, n = 9; NNTKO background, n = 16). d, Enzymatic activities of citrate CS (upper), short chain 3-hydroxyacyl CoA dehydrogenase (SCHA) versus CS (middle) and isocitrate dehydrogenase (ISDH) versus CS (bottom) measured by spectrophotometry in the different mouse genotypes in HFD (n = 10); AU, arbitrary units. e, Ketone bodies (KB, upper), glucose (middle) and protein (bottom) concentration in urine in the indicated mouse genotypes in the HFD group (glucose and protein, n = 4; KB, n = 8). *, P < 0.05; **, P < 0.01; ***, P < 0.001; and ****, P < 0.0001; significance was assessed by one-way ANOVA test and Tukey’s post hoc test. Each point represents a biological replicate. Data are shown as the mean ± s.e.m.

