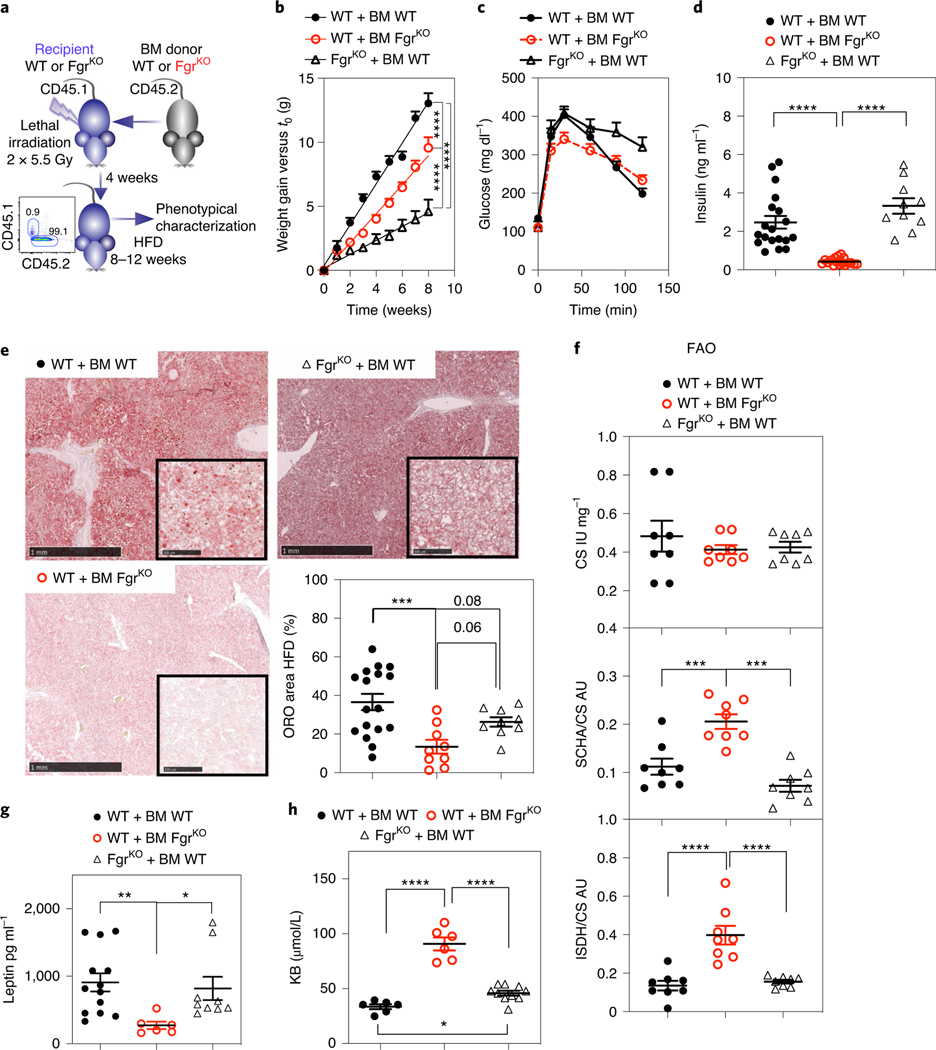
Fig. 5 |. Lack of Fgr in BM-derived cells protects from HFD-induced liver steatosis.
a, Schematic indicating the strategy for BM transplantation and HFD treatment, and representative histogram showing full reconstitution of CD45.1 host with CD45.2 donor BM. b, Weight gain over time in HFD-fed mice after BM transplantation of the indicated genotypes (n = 16). c, GTT of BM-transplanted mice as indicated in HFD (n = 9). d, Basal insulin levels in BM-transplanted mice as indicated for the HFD group (n = 10). e, Representative ORO staining of OCT liver sections of the indicated genotypes in HFD. Scale bars: 1 mm (low magnification view) and 100 μm (insets). Quantification of ORO-positive stained area versus total liver area in OCT liver sections of the indicated genotypes in the HFD group (n = 8, right bottom). f, Spectrophotometric enzymatic activities of CS (upper), SCHA versus CS (middle) and ISDH versus CS (bottom) in the different mouse genotypes in the HFD group (n = 8). g, Analysis of leptin levels in the serum of BM-transplanted mice as indicated in the HFD group (n ≥ 6). h, Analysis of ketone bodies (KB) in the urine of BM-transplanted mice as indicated in the HFD group (n ≥ 7). Significance was assessed by linear regression in b and one-way ANOVA with Sidak’s correction for multiple comparisons in d–h. *, P < 0.05; ***, P < 0.001; and ****, P < 0.0001. Each point represents a biological replicate. Data are shown as the mean ± s.e.m.

