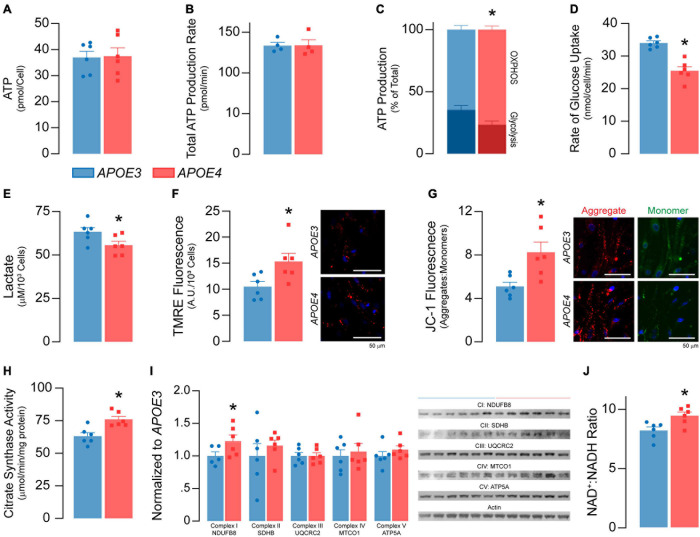
FIGURE 4.
APOE4 brain endothelial cells have lower glycolysis and higher oxidative phosphorylation and mitochondrial activity compared to APOE3. (A) ATP levels and (B) the rate of total ATP production (n = 4) are similar in APOE3 and APOE4 brain endothelial cells. Glycolysis and mitochondrial oxidative phosphorylation (OXPHOS) both contribute to ATP production. Comparing the bioenergetic profiles of APOE3 and APOE4 brain endothelial cells revealed (C) ATP production from OXPHOS is higher and glycolysis is lower with APOE4 as measured by Seahorse XF Real-Time ATP Rate Assay (n = 4). Consistent with lower glycolytic activity, APOE4 brain endothelial cells also have (D) a lower rate of glucose uptake and (E) lower levels of lactate in the media compared to APOE3. Mitochondrial activity is central to OXPHOS, which may be higher with APOE4. We measured mitochondrial activity using complementary approaches. Active mitochondria have a greater net negative charge that can be measured by the accumulation of tetramethylrhodamine ethyl ester (TMRE) and aggregation of JC-1 (monomer, green; aggregate, red) dyes. In APOE4 brain endothelial cells there is (F) higher TMRE staining (∼46%) and (G) aggregate:monomer ratio of JC-1 (∼62%). (H) Citrate synthase activity, which is important for the first step of the Krebs cycle, is also higher with APOE4 (∼20%), as are transcripts of electron transport chain components (e.g., mt-Nd1, mt-Nd2, mt-Nd4, mt-Nd5, mt-Cytb, mt-Co1 Supplementary Table 2), which (I) we validated at the protein level. (J) Nicotinaminde adenine dinucleotide (NAD) is a co-factor present in two forms in a cell; NAD+ (oxidized) and NADH (reduced). NADH is utilized in the electron transport chain to donate electrons for ATP generation and as a co-factor for enzymatic activity. The ratio of NAD+:NADH is higher with APOE4, data that may imply lower NADH levels to supply the cell with energy, or that high levels have been oxidized to sustain higher mitochondrial function. Data is expressed as mean ± S.E.M. *p < 0.05 by Student’s t-test with n = 6 (unless otherwise specified above).

