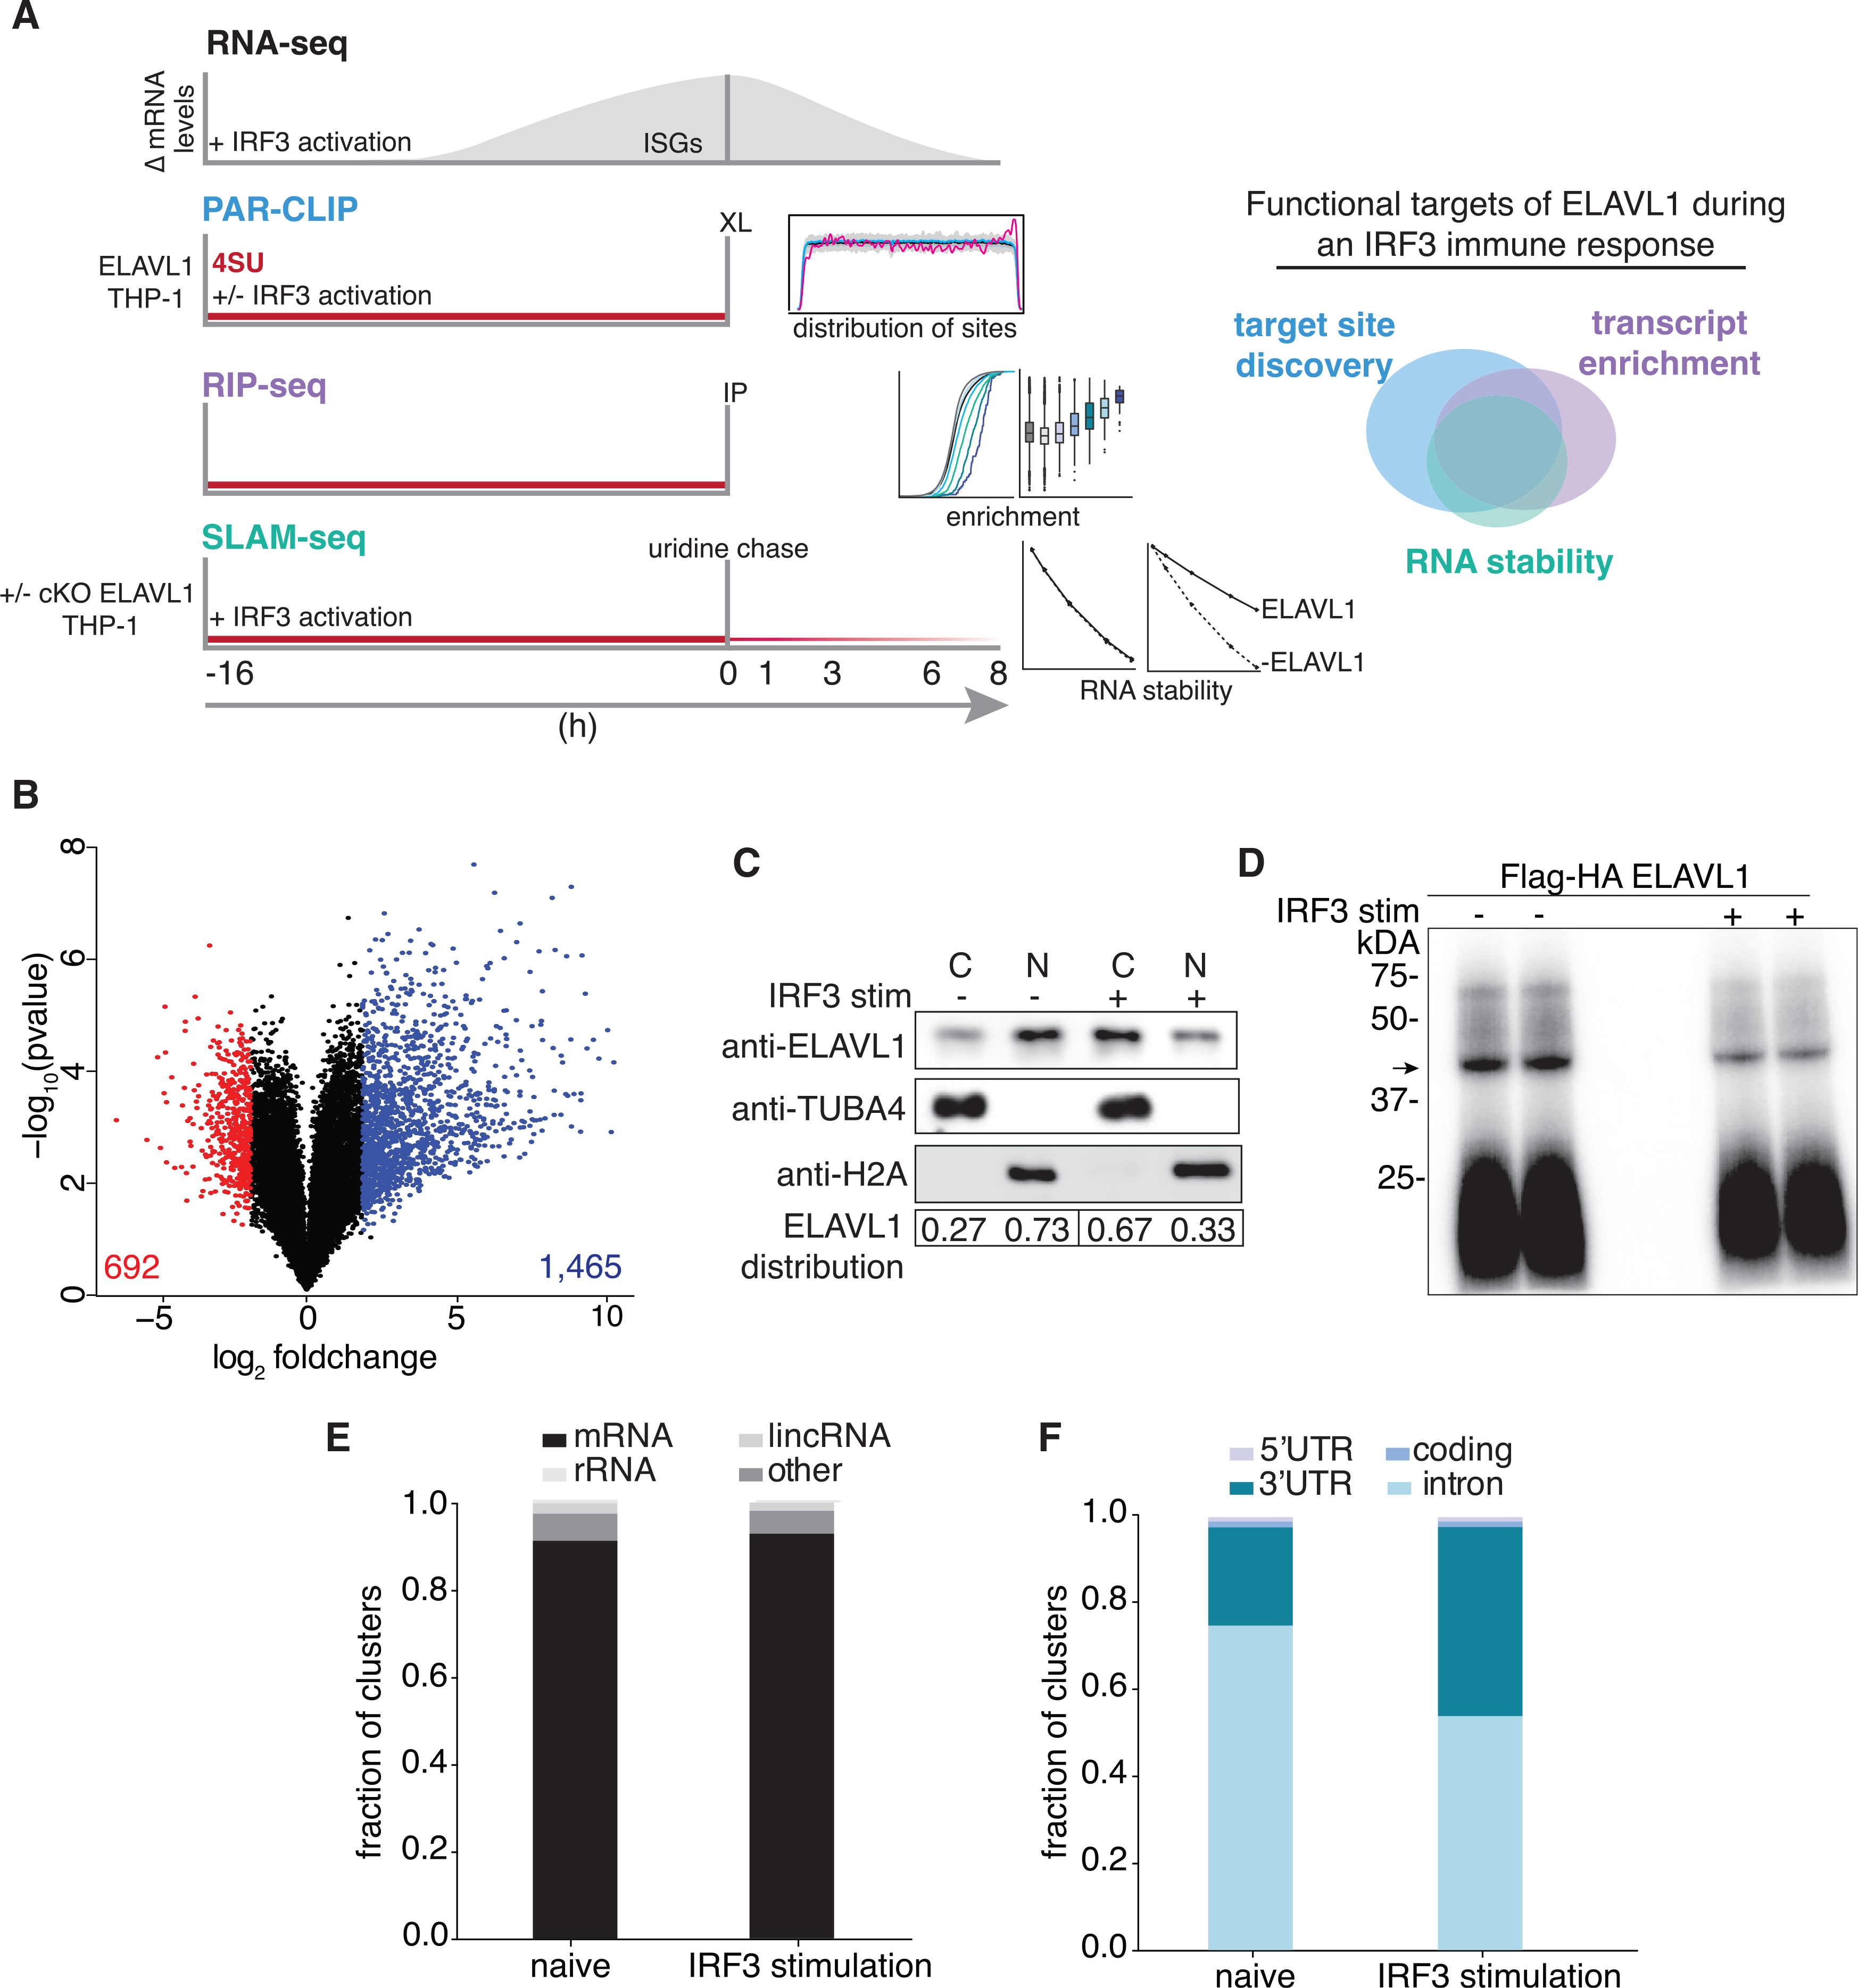
Figure 1. RNA-seq and PAR-CLIP capture the context-dependent RNA substrates of ELAVL1.

(A) Schematic of the experimental design used to define how ELAVL1 regulates its mRNA substrates during an innate immune response. The Venn diagram (right panel) illustrates how high-throughput datasets will be used to assess the functional targets of ELAVL1.
(B) Volcano plot comparing the differential mRNA levels between naive and stimulated THP-1 cells. The red and blue represent the downregulated and upregulated transcripts in response to cGAMP stimulation, respectively.
(C) Immunoblot showing the nuclear or cytoplasmic distribution of ELAVL1 during a naive and stimulated state. Tubulin and histone 2A are shown as localization controls. The quantitation is showing the percentage of total ELAVL1 in each compartment.
(D) Phosphorimage of 32P-RNA bound to ELAVL1 in the naive and stimulated THP-1 cells. Arrow denotes the ELAVL1 bound RNA.
(E) Distribution of ELAVL1 binding sites across indicated RNA categories.
(F) Distribution of binding sites across different mRNA transcript features for naive and stimulated PAR-CLIP samples.
