
Figure 2. Innate immune stimulation pivots ELAVL1 binding toward 3′ UTR sites.
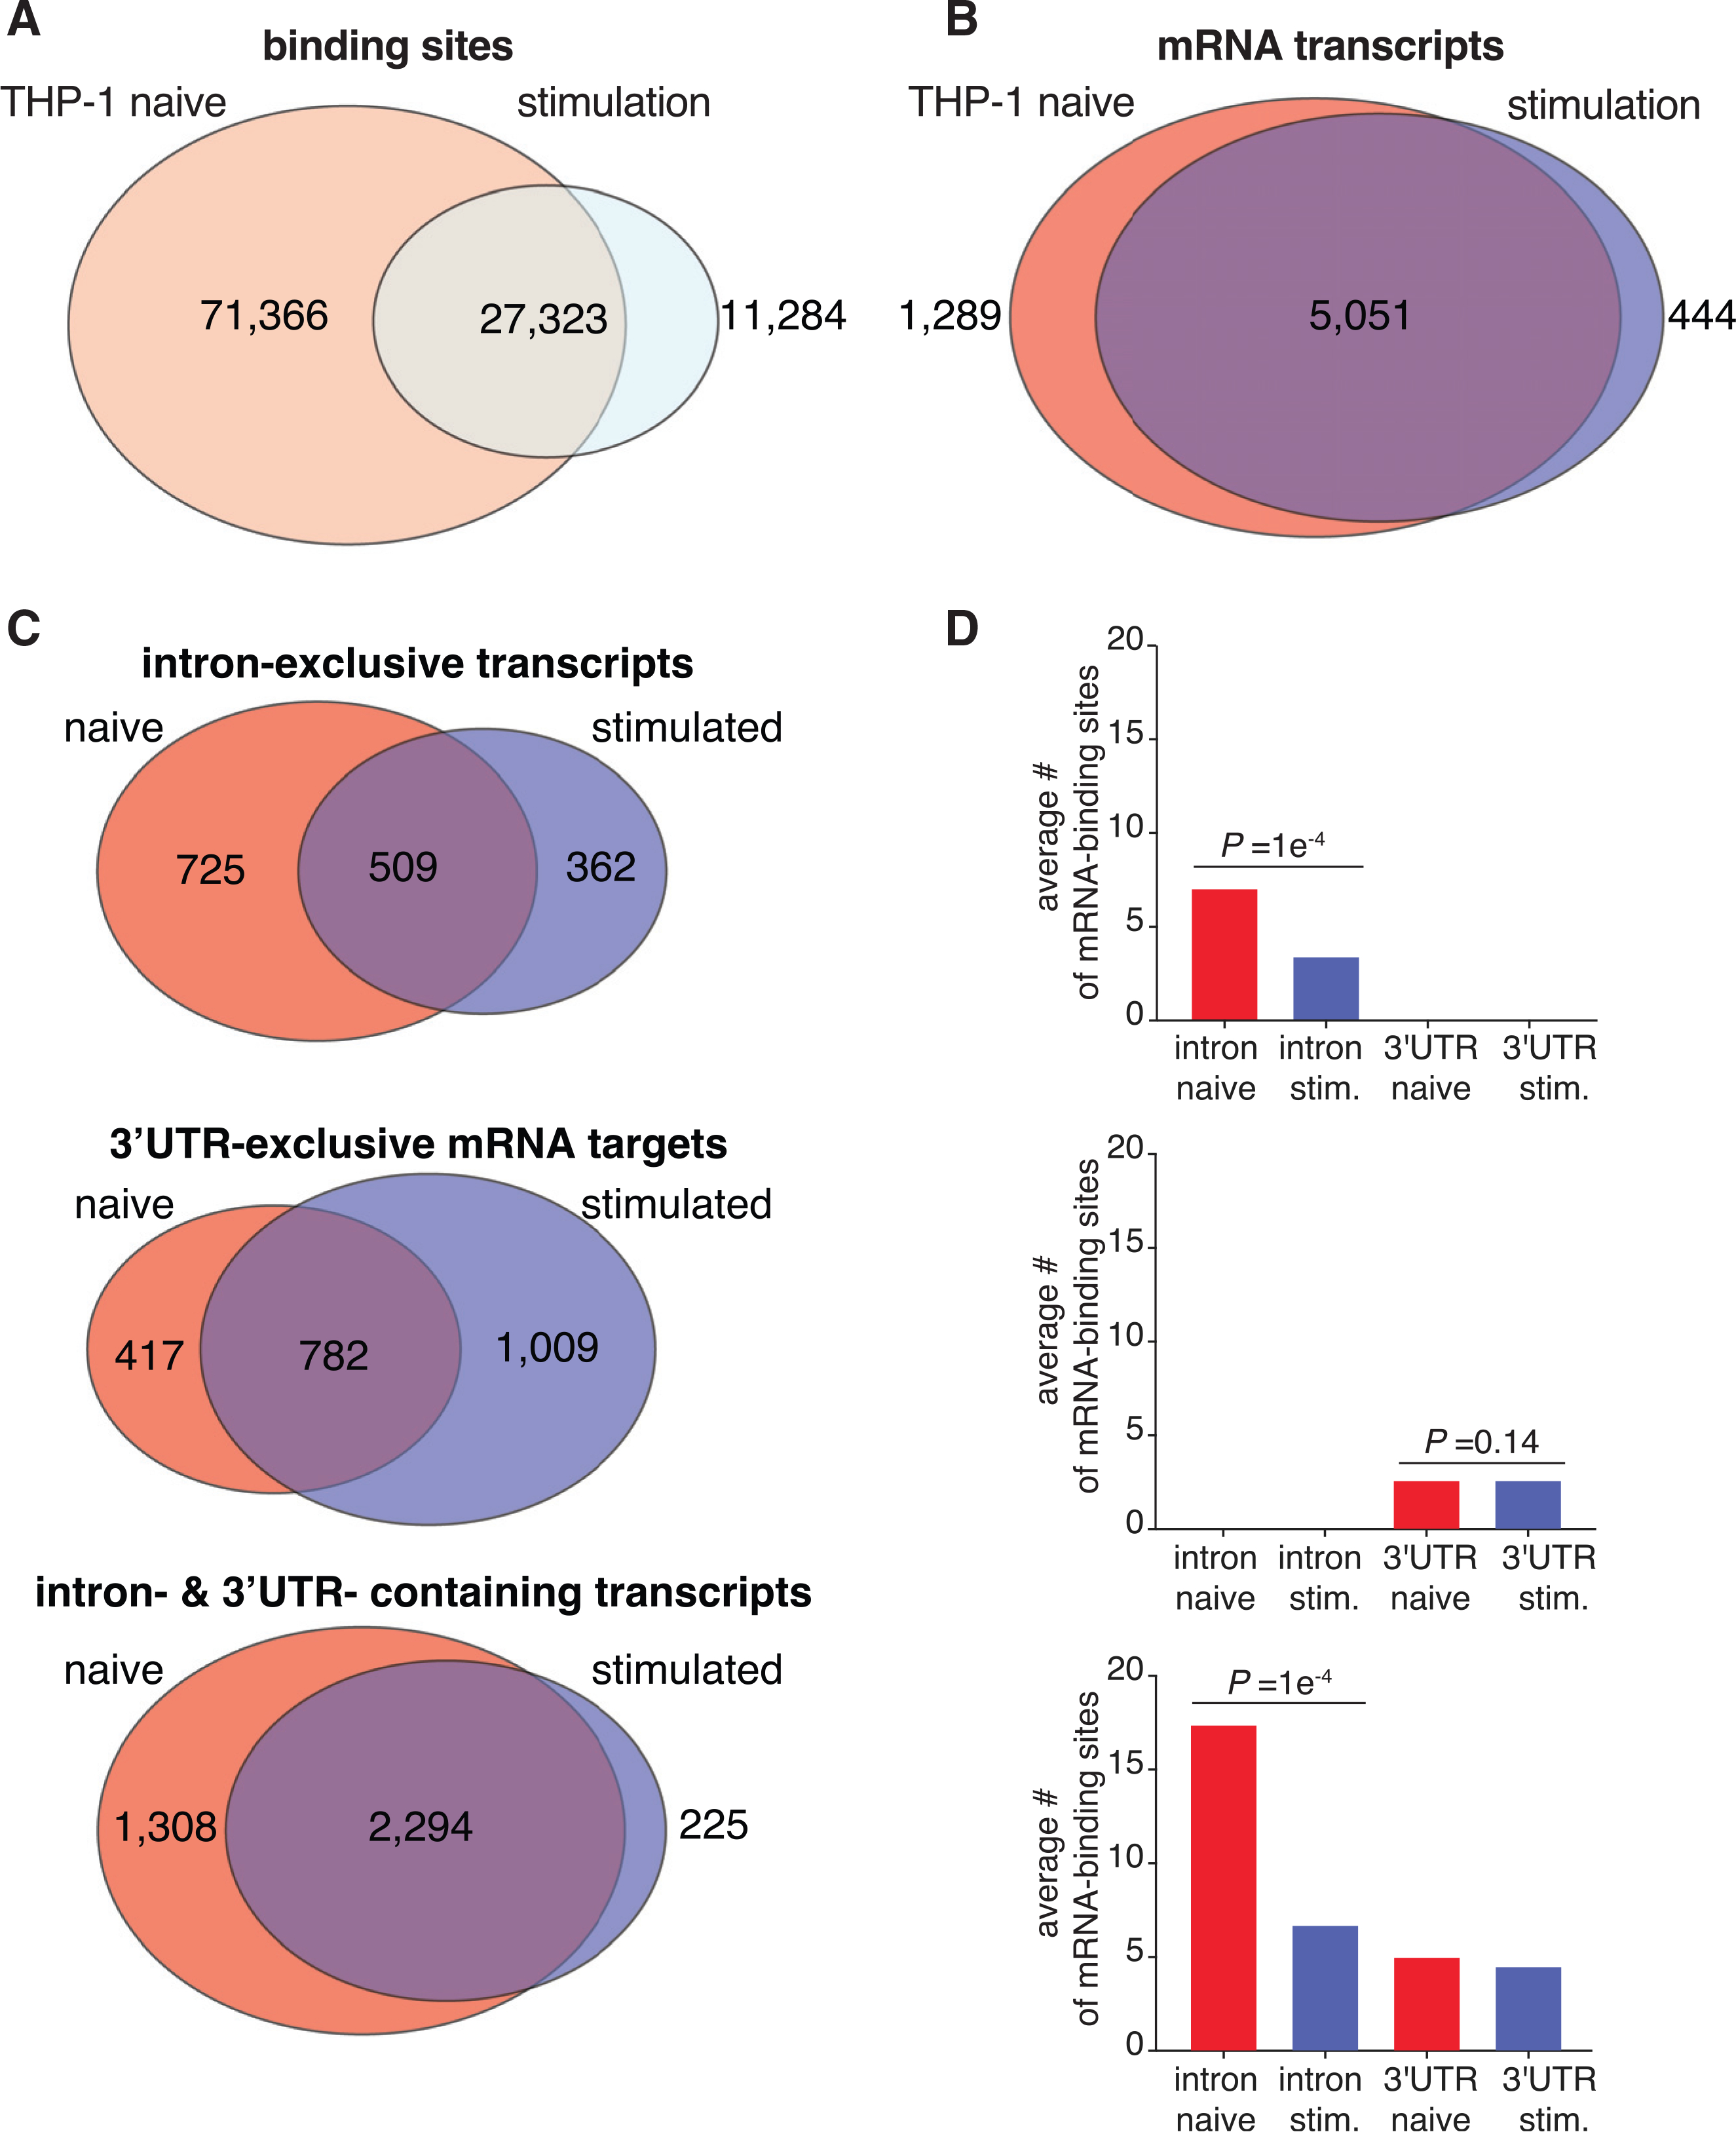
(A and B) Venn diagrams of the PAR-CLIP-defined ELAVL1 clusters (A) or bound transcripts (B) between the two states.
(C) Venn diagrams indicating the number of transcripts in naive and stimulated cells that are bound exclusively in the intron, 3′ UTR, or both.
(D) The average number of binding sites for the three mRNA location categories listed across conditions. p values were calculated using Student’s t test.