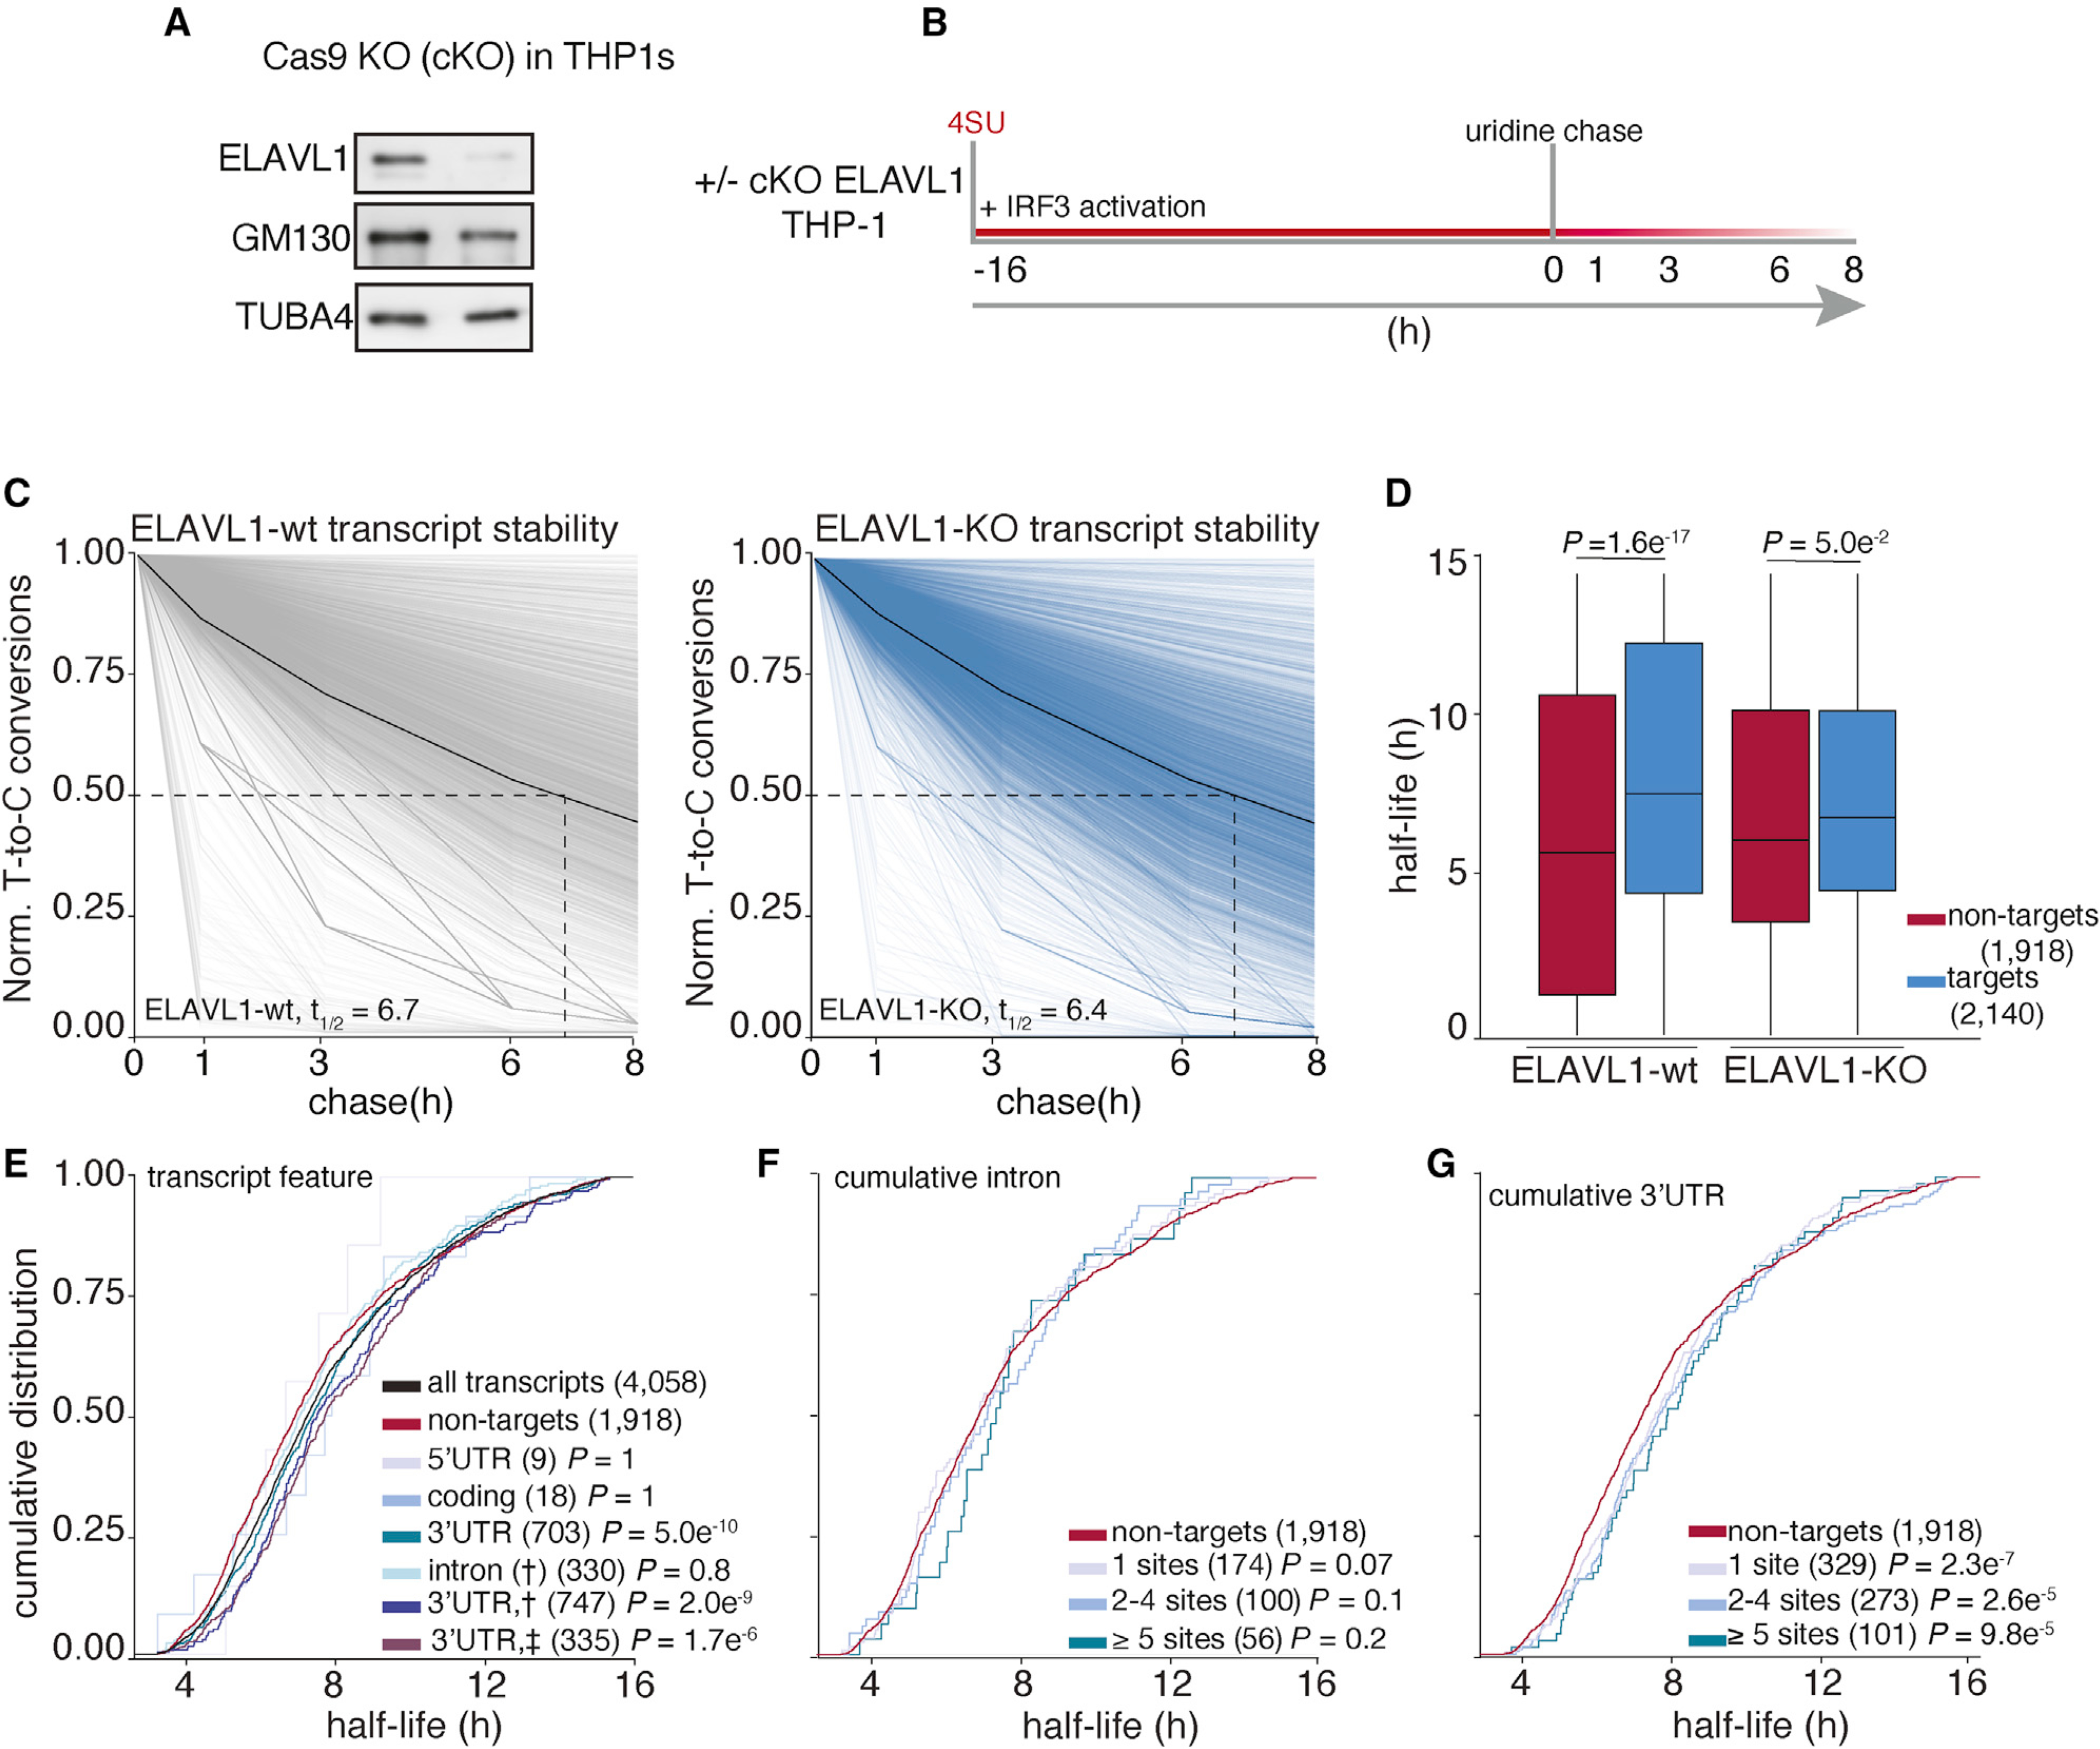
Figure 5. Analysis of transcriptome-wide mRNA stability in the absence of ELAVL1.

(A) Immunoblot staining for endogenous ELAVL1-WT and ELAVL1-KO THP-1 cells.
(B) Schematic of the SLAM-seq experiment setup. THP-1 cells ( ± ELAVL1KO) were stimulated, and 4SU was labeled for 16 h before wash and uridine chase. Time points for SLAM-seq were 0, 1, 3, 6, and 8 h after uridine chase.
(C) The decay of T-to-C conversions was determined by fitting the data to a single-exponential decay model to derive mRNA half-lives (dotted line). Graphs show that the RNA stabilities over time. The solid black line indicates the median T-to-C conversion rate over time; the dotted black line denotes median half-life (t1/2), as indicated per condition.
(D) Boxplots showing the median half-lives of non-targets (red) and targets (blue) in the ELAVL1-WT and ELAVL1-KO cells.
(E) Cumulative distribution fraction analyses of the RNA half-lives. Transcripts were grouped by the location of the ELAVL1 binding sites.
(F and G) Cumulative distribution fraction analyses were used to determine whether the RNA half-lives of targets are affected by the number of (F) intronic or (G) 3′ UTR binding sites.
