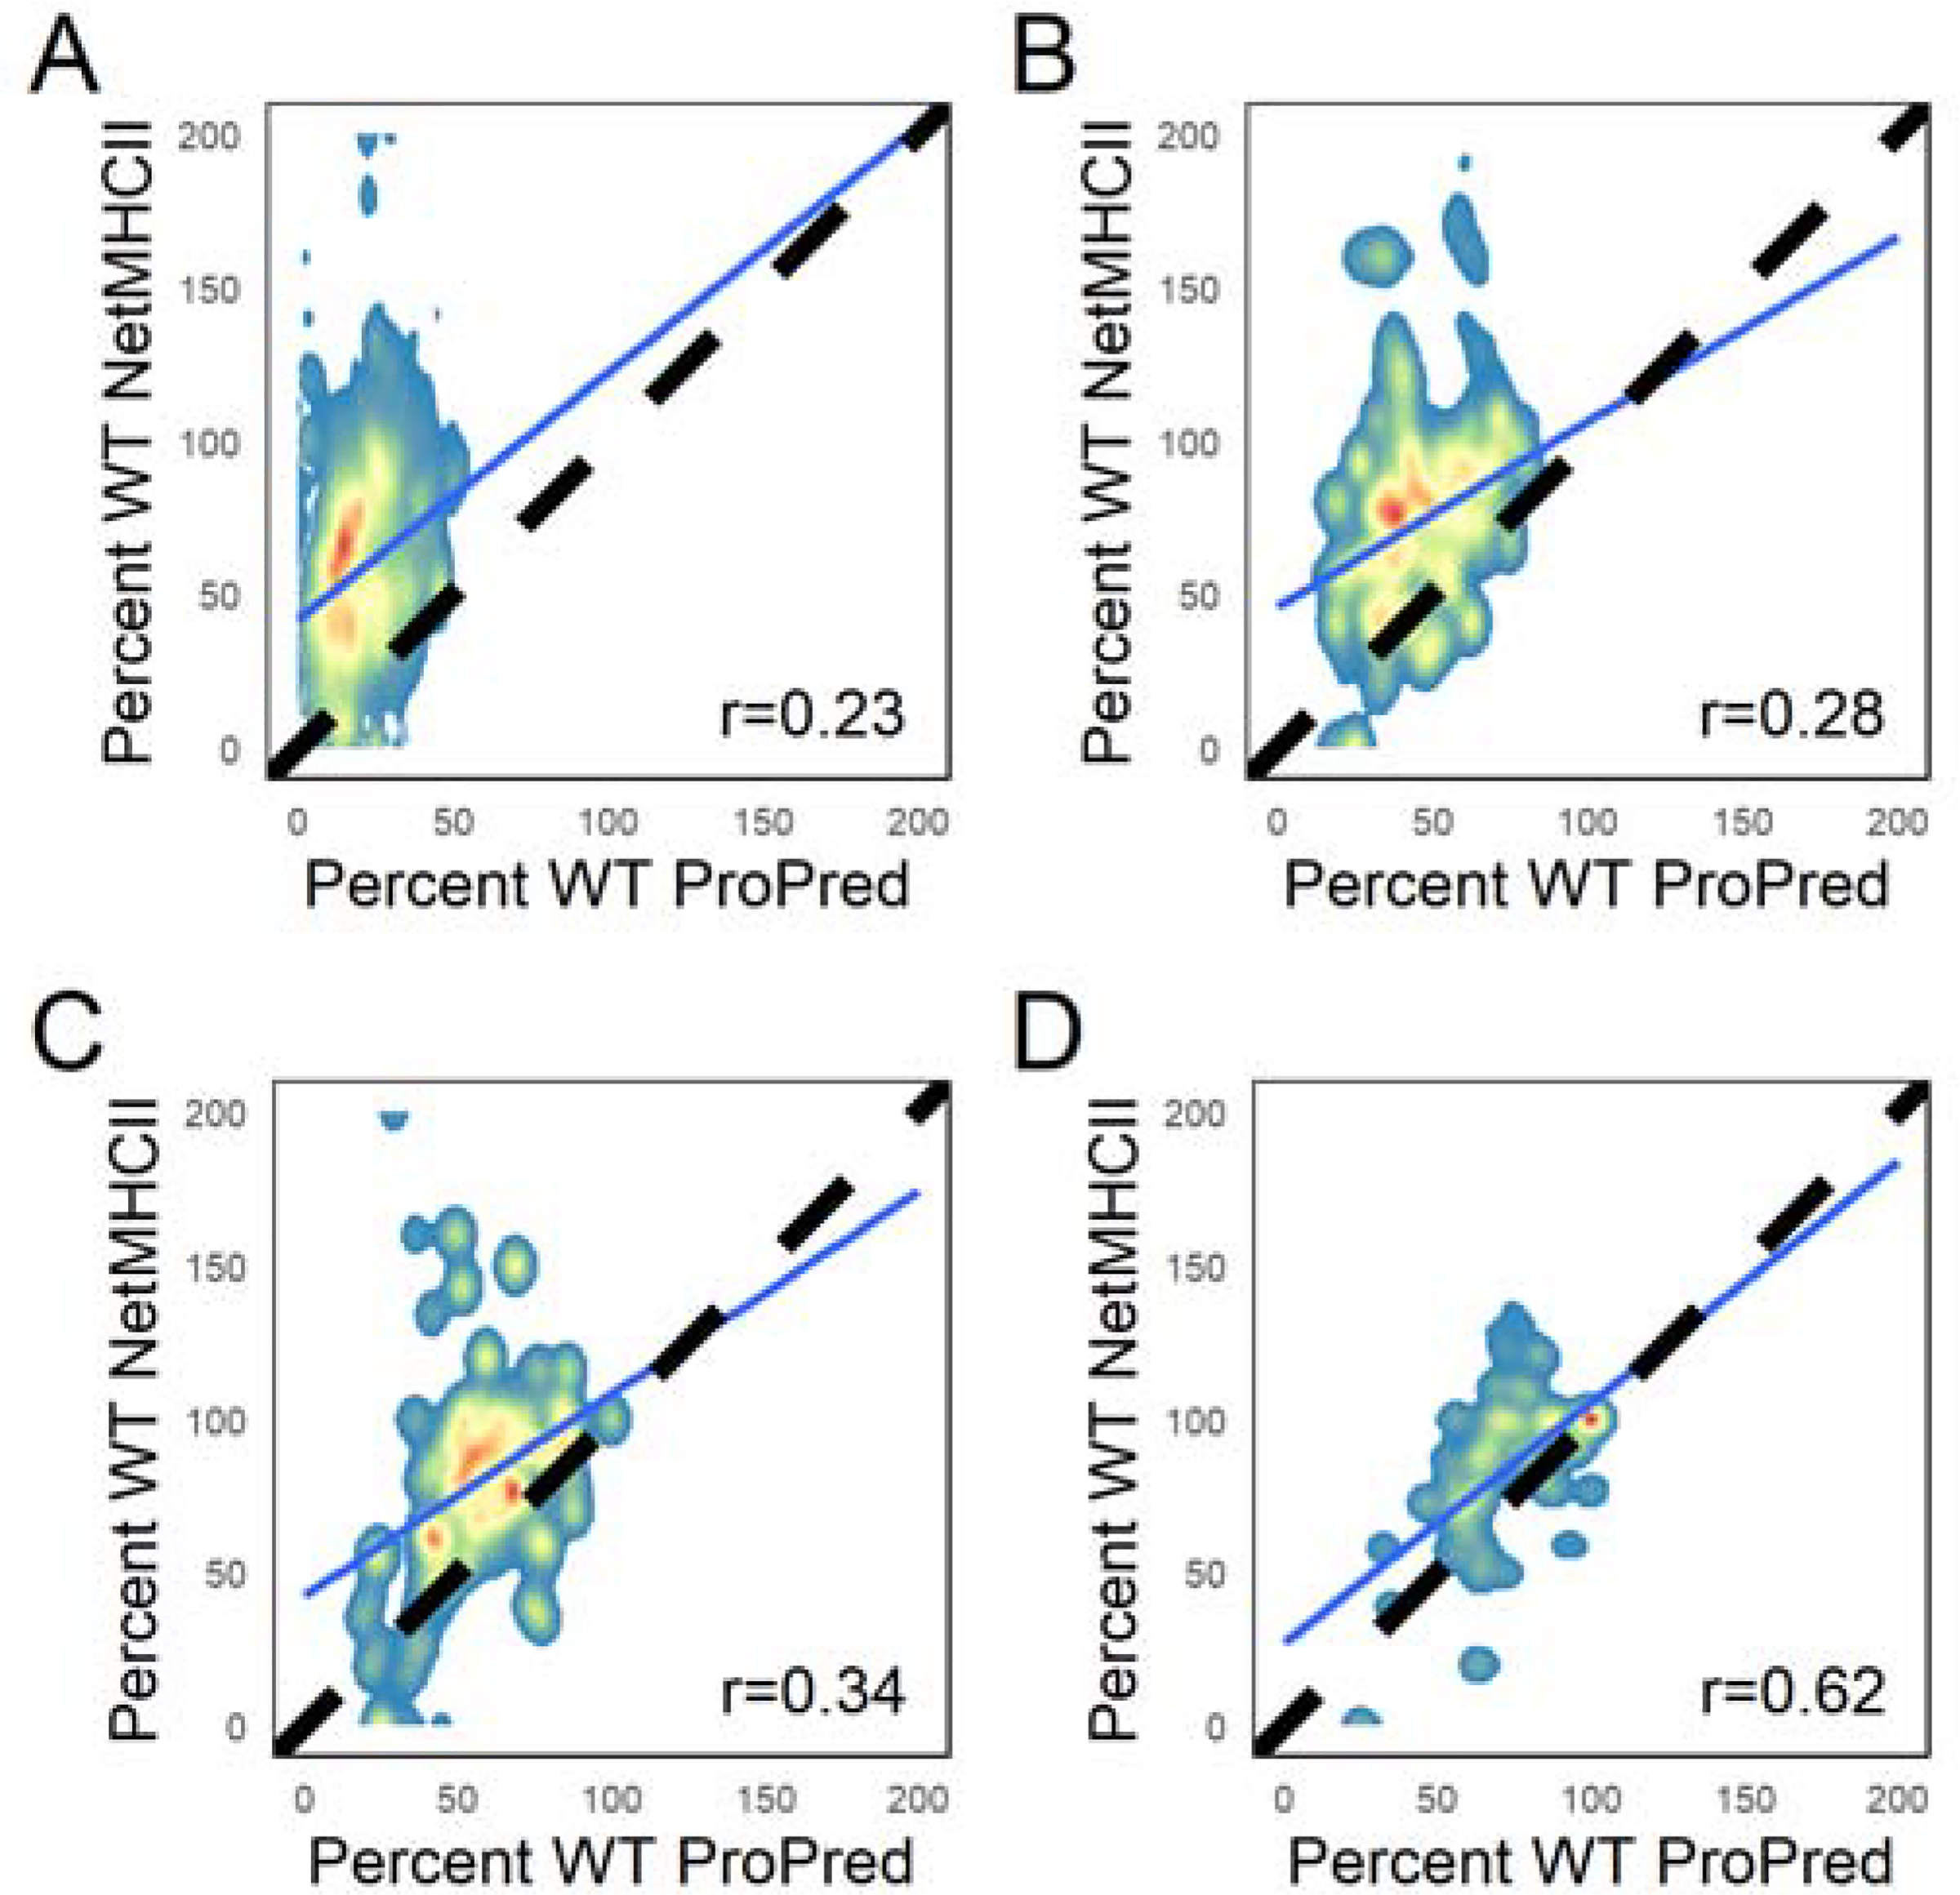
Figure 7.

Correlation between ProPred scores (Southwood35 allele set) and NetMHCII scores (Paul37 allele set) in ProPred-deimmunized designs with varying PSSM restriction thresholds (n=240/target). In (A), no PSSM restrictions were applied. In the remaining plots, a base 2 log odds threshold of (B) 1, (C) 2, and (D) 3 was applied to limit allowed amino acid types at each position during design. The dashed line indicates designs with identical percent wild-type ProPred and NetMHCII scores. The Pearson correlation between the two scores for each threshold is given in the bottom right, and the line of best fit is shown in blue.
